What is the Footprint Chart? – Trading tutorial
Table of Contents
What is the Footprint Chart and how does it work? – The Footprint Chart is very important for online trading and used by professional traders. On this page, we will explain to you how to read this type of chart and why it is so useful. Get free and professional knowledge in the next sections. In addition, we give you tips and tricks (Books, PDF). Improve your trading because knowledge is power.
Footprint trading vs. Candlestick trading
The Footprint Chart offers you more advantages than the normal Candlestick Chart. The Footprint chart shows you exactly the traded volume on the price. It is a graphical presentation of the limited order book but you only the traded volume. With normal the normal Candlestick Chart, you will not get this information.
It is like you look into the candle and see what happened. Especially for day trading, it is important to use the Footprint Chart because you can interpret easily why the price is moving. In the picture above you see the Footprint Chart in candlestick formation. In the next sections, we will present to you how to read the Footprint Chart.
What do you see in a normal Footprint Chart:
- Vpoc (most traded volume in the candle)
- Traded volume on ASK
- Traded volume on BID
- Candle open
- Candle close
- High and low of the candle
- Buy or sell imbalance (if you mark it)
The Footprint Chart is so special because you see the traded volume on the price exactly. The market can only move through direct market orders which are consuming the limit orders of the order book. For a deeper explanation, you can read our article “Order flow Trading”.
Traders can interpret the traded volume and develop trading strategies. For example, it is easy to see in the Footprint Chart if the market stops trading on a price level or trades high volume. Also, you can see if there is more bid or ask pressure in the candle. There are many forms of analyzing the Footprint Chart and on this page, we will give you advice on this.
How to read the Footprint Chart
In the following picture, you see the details of the Footprint Chart explained. In the following section, you will learn how to read it. By using the Footprint Chart you will get more information than using the normal chart. For beginners, there are different areas of the candle which are new for them. There is the Vpoc, high and low of the candle, open and close of the candle, traded BID and ASK.
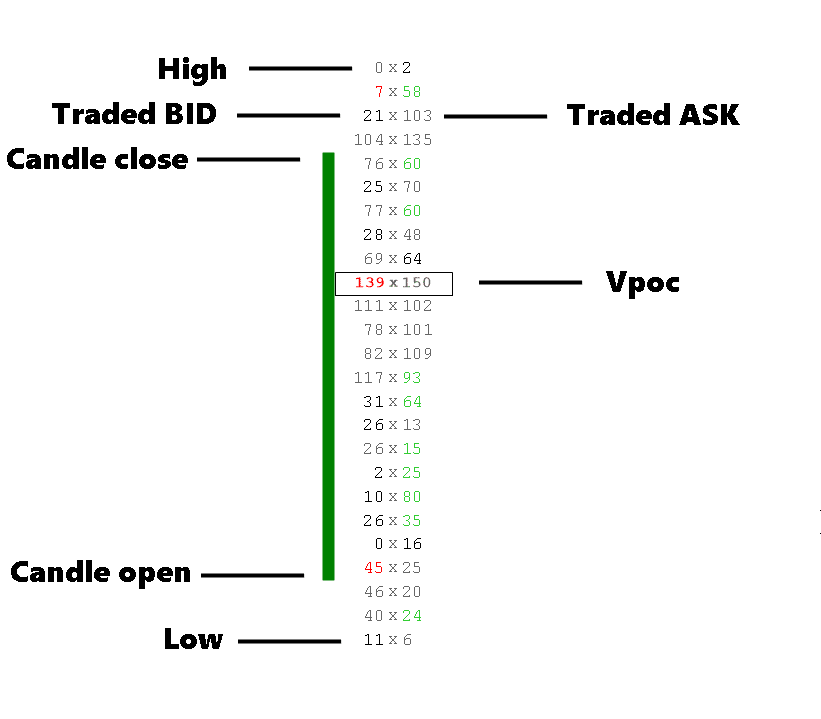
High and Low
The Footprint Chart candle shows you like the normal candle the high and low.
Candle close and open
The Footprint Chart candle shows you like the normal candle the candle closes and opens.
Vpoc – Point of Control (Volume)
Vpoc means “Volume Point of Control”. It is the price where the most volume is traded. It is a market with the box in the candle but it depends on your order flow trading software. There are different settings but the most popular setting is the most traded volume. Now you can analyze if the volume is on the high, middle, or bottom of the candle. This gives you the possibility of different trading strategies.
Traded BID and traded ASK
The market works through the limited order book and is moving by market orders or stop orders which get triggered. More about this technique you can read in the article “order flow trading“.
For example, if somebody buys a market you will see the trade in the footprint chart if the trader got filled. The market orders are working up and down towards the order limits. For interpretation, you can see where is the most volume traded and where it is not. BID means limited buy orders which are triggered by market sell orders. ASK means limited sell orders which are triggered by market buy orders.
Red or green colored numbers
Also, in the picture, you see red and green colored numbers. These are imbalances that are market automatically. It depends on your strategy which imbalances you want to show. It shows you strong buying or selling pressure.
The Footprint Chart is the past of the order book
In principle, the Footprint Chart is the past of the order book. All traded contacts in the market (trade completed) are displayed graphically. By understanding the order book or order flows, the Footprint Chart can also be better understood. In the picture below you can see the order book.
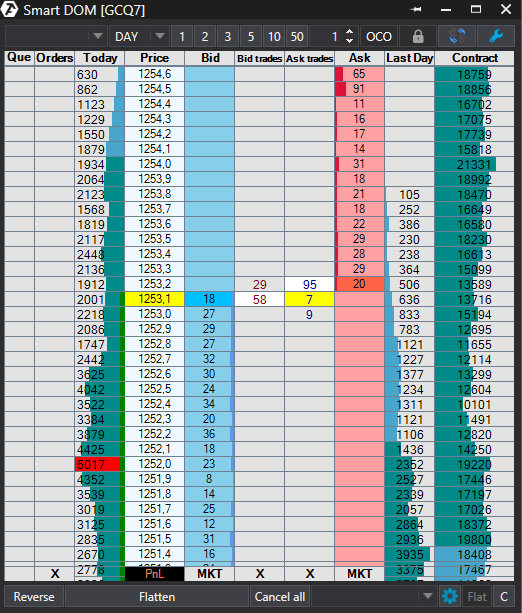
On the “BID” and “ASK” the limit orders are waiting to be triggered. Traders use these limit orders to say that they want to buy or sell at a certain price. Other traders then buy or sell directly at the current price. The market order triggers the limit order.
Price formation:
If there are too few limit orders on a price, the exchange must find a new price. Depending on supply or demand, the price rises or falls. The exchange constantly changes the price between the next “BID” or “ASK”.
Professionals also call this system a “matching engine”. Buyers and sellers are matched.
No execution or slippage:
Generally, private traders always get the worst execution in the markets. Institutions or banks with a lot of money have the best infrastructure for trading. As a trader, you may not get an execution at the price you want. Either your limit order is not executed or the direct market execution is delayed by a few points.
It has happened to me many times that the market is right at my limit order and the limit order is not triggered. For example, at the price of $ 10, there are over 1000 limit buy orders but only 500 market sell orders come into the market. 500 limit buy orders are then not executed.
In case of slippage, the market moves very fast and you don’t get execution by market order or buy/sell stop. There are not enough limited orders available and the broker executes you at the next best price. This can happen very quickly in markets with little liquidity.
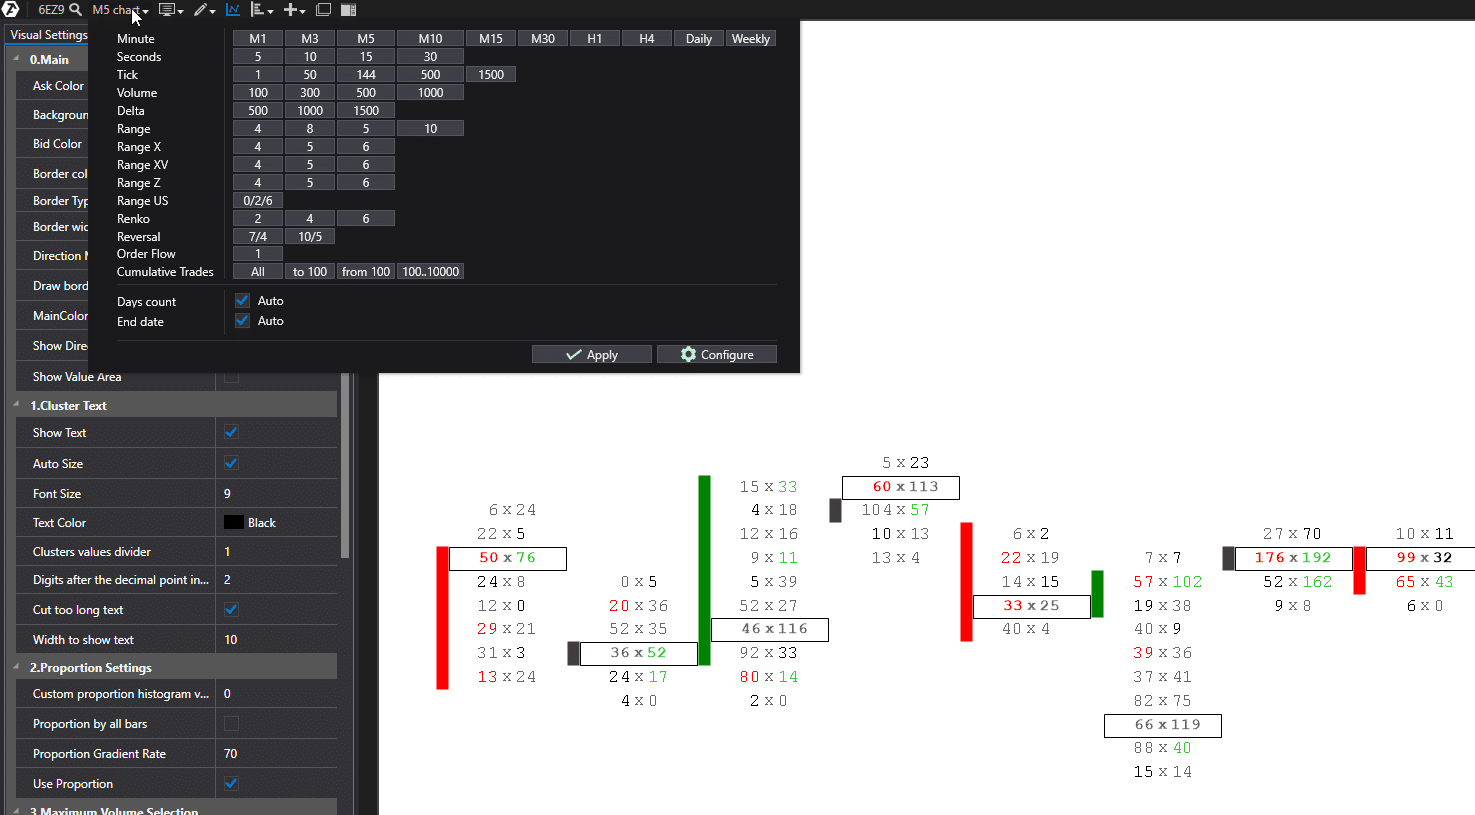
Footprint Chart customization:
It always depends on your trading software which option you can customize. In the picture below we are using the order flow software ATAS to show you some examples. There are more than 10 different chart types that are available as footprint charts. It is easy to change via the menu or shortcuts. In addition, you can change the colors, vpoc, and Bid/Ask Imbalance settings.
As you see in the picture below it is very easy to customize. If you want to change the normal candlestick chart into the Footprint Chart you only have to zoom in. The Footprint Chart acts as a magnifying glass for the markets.
Which Footprint Chart software is the best:
On the internet, there are a lot of different programs for the Footprint Chart. In this section, we can only speak from our experience. We did not test all the programs which are available for traders. For order flow trading we can recommend the software ATAS or Sierra Chart. These are 2 professional programs that offer you the functions you need for successful trading.
ATAS – Order Flow Trading

The ATAS Order Flow Trading Software offers order book trading, chart trading, different footprint charts, and more professional functions. The biggest advantage of this software is that it is a very user-friendly program. It is not the cheapest software but very easy to use and configure. Beginners should feel comfortable with it in a few days. Also, you can test it for free. Read our full review of the software ATAS. Read the full review of the Order Flow Software ATAS
Sierra Chart – Trading and Charting

Sierra Chart is more professional software for online trading. It offers more functions than ATAS but the design is more old fashioned and more difficult to use because there are so many functions that it is easy to lose the overview. We can recommend the trading software Sierra Chart for trading but you will need a lot more time to use it correctly and in the way you want. Sierra Chart can be bought with a small amount of money in a monthly subscription.
Which broker we can recommend for Footprint Chart Trading?

For trading with a real footprint chart, you need access to the stock exchange and a brokerage account. Most traders are investing in futures by using short-term scalping or day trading orders. For trading with futures and footprint charts, we can recommend the broker Dorman Trading. It is a US-based broker that accepts international clients. The account minimum is only $2,500 and there are no additional fees. Also, the trading commissions are very cheap.
Advantages of Dorman Trading:
- The account minimum of $2,500
- No inactivity fees
- No monthly fees
- No hidden fees
- No maintenance fees
- Professional support and account helping
(Risk warning: Trading Futures and Options on Futures involves a substantial risk of loss and is not suitable for all investors. You should carefully consider whether trading is suitable for you in light of your circumstances, knowledge, and financial resources. You may lose all or more of your initial investment. Opinions, market data, and recommendations are subject to change at any time. Past performance is not indicative of future results. Stage 5 Trading Corp. is a member of NFA and is subject to NFA’s regulatory oversight and examinations. However, you should be aware that NFA does not have regulatory oversight authority over underlying or spot virtual currency products or transactions or virtual currency exchanges, custodians, or markets. This is an introducing broker link and we share a $3 commission with the broker)
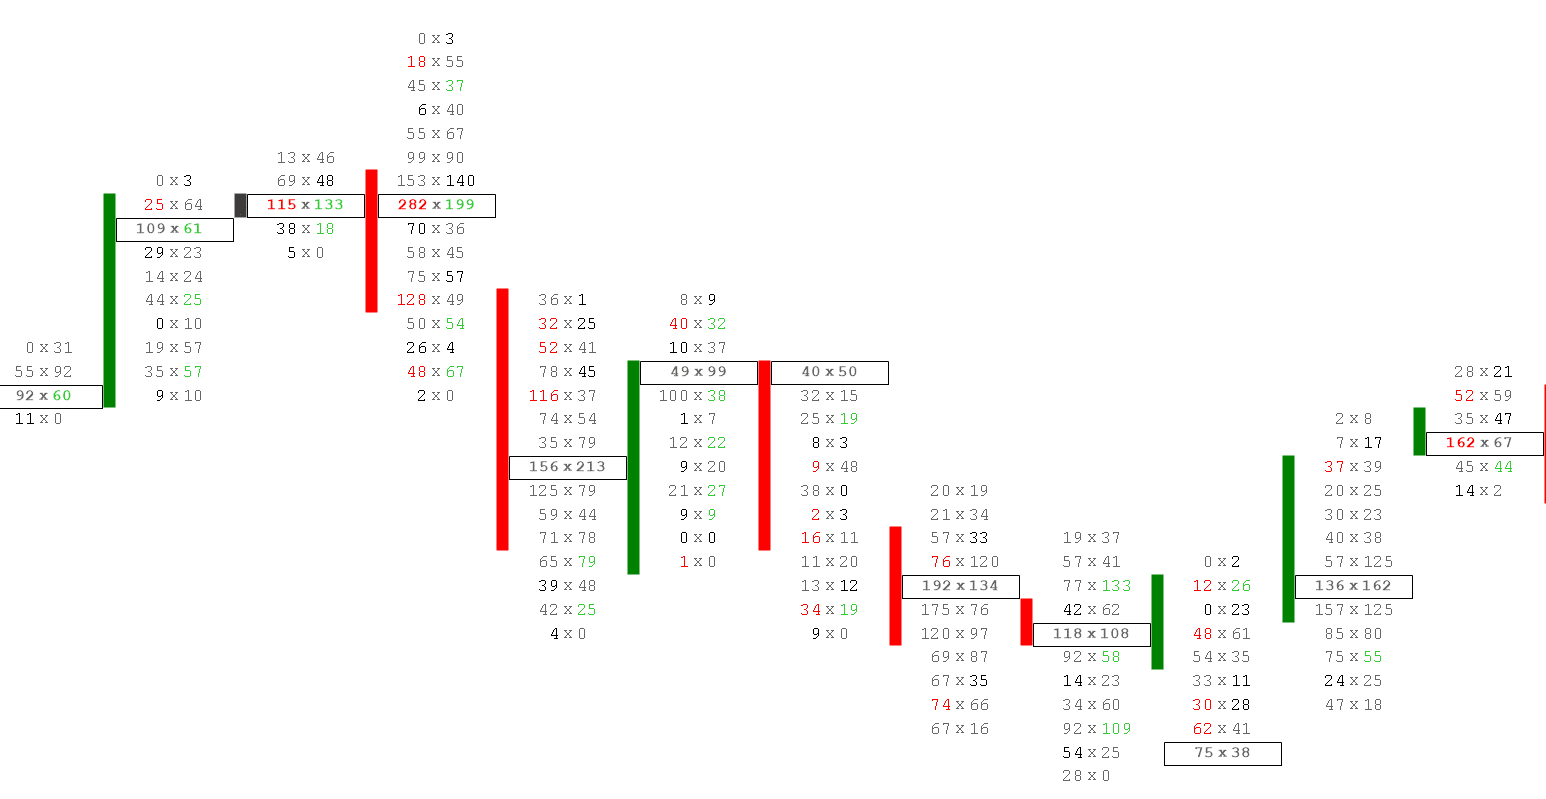
Footprint Chart trading strategies explained
In the following, we will discuss some strategies for beginners and even experienced traders. Read the Footprint Chart does not have to be difficult. As a beginner, you will see so many numbers and you do not know the importance.
Now we present you some simple techniques to spot a reversal in the market with the Footprint Chart. Most traders can not read the Footprint Chart correctly but you only have to pay attention to some small things. In the picture below you see a typical reversal that is marked in the red box. The market comes down and out of nowhere, there is a reversal.
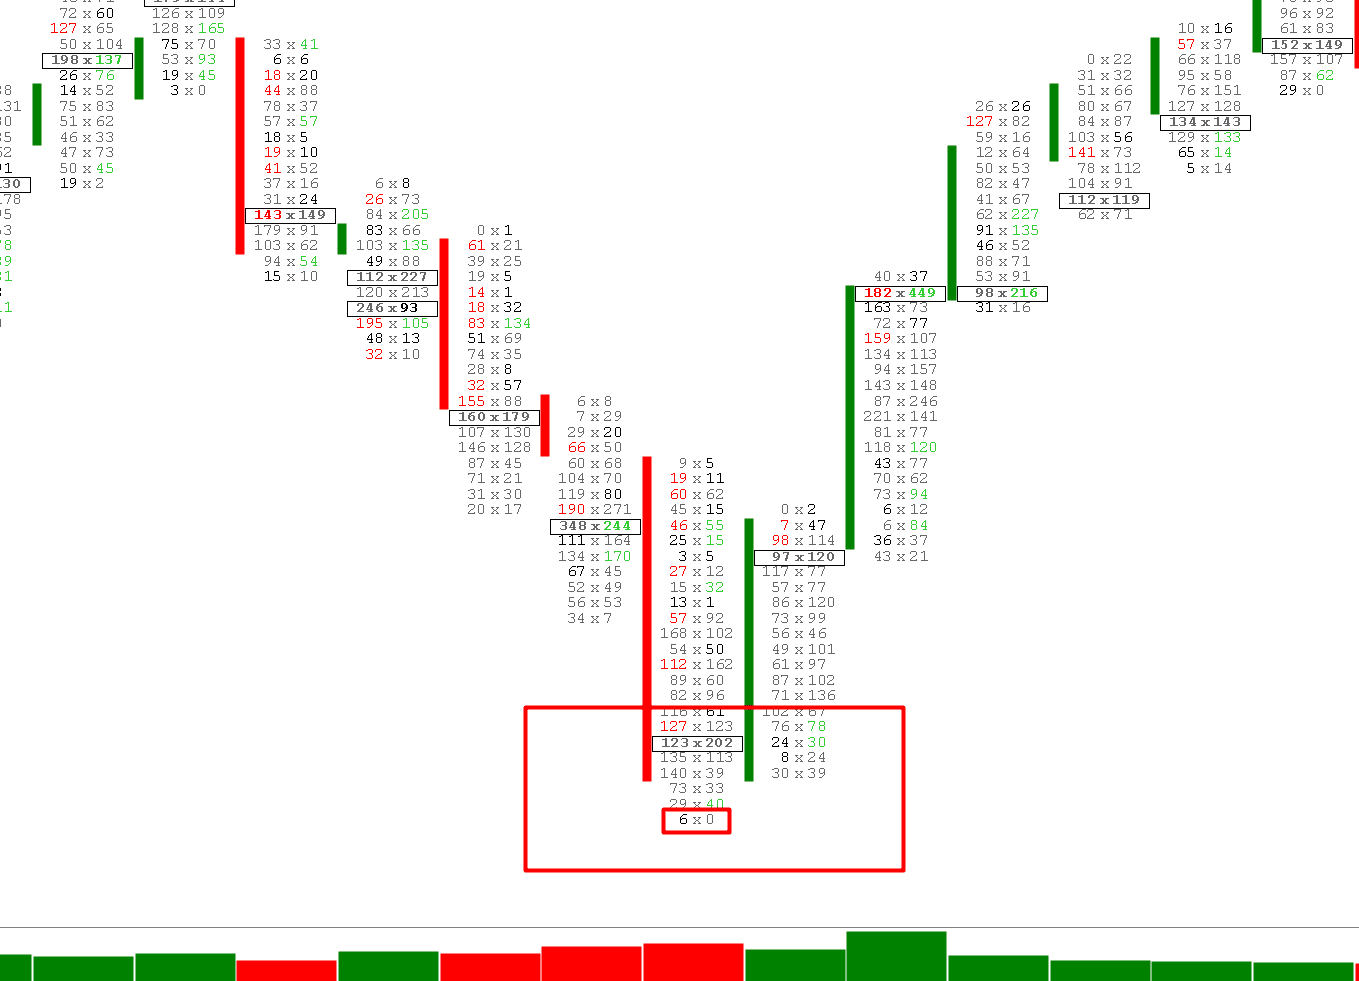
On the bottom price, you see the “6 x 0”. That means the market tries to push lower but only 6 contracts are sold per market at this price. No one is willing to sell more than 6 contracts at this price and the matching engine knows that. If nobody is selling more buyers come in and press the market up. You can spot a reversal very easily with the Footprint Chart if there is low volume traded and the sellers (for this example) try to sell into a price but there are more buy limits than market sellers. You can read this in the “6 x 0”.
We do not recommend only using the Footprint Chart alone because it would be blind trading. Furthermore, you have to see some important price levels. We recommend doing a chart analysis or volume analysis and then searching for the entry in the Footprint Chart.
What happens here:
- Market sellers sell only 6 contracts
- No more sellers come in
- The price can not go down because there are more buy limits
- Low volume
- More buyers come in than seller
- You see it with the “6 x 0” that the sellers press 6 down but no one follows
- Low volume indicates a reversal
Find support and resistance with the Footprint Chart
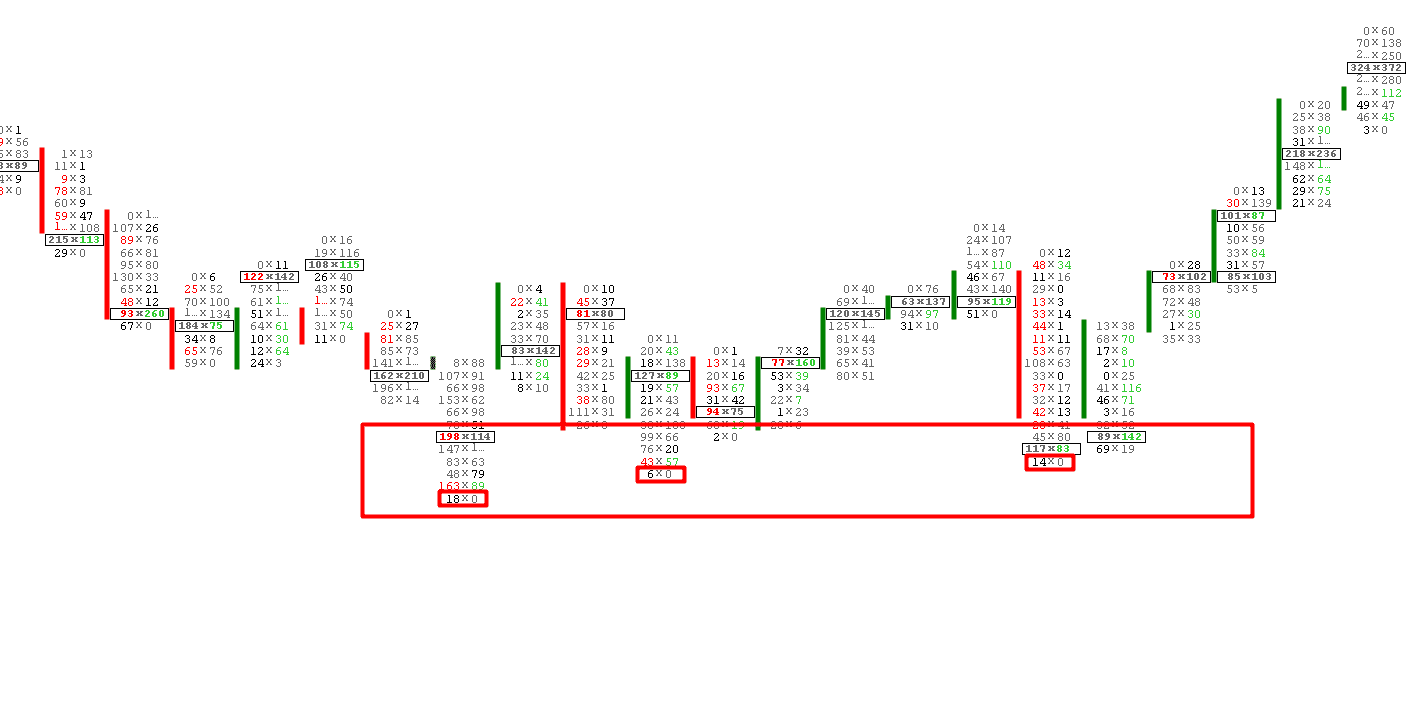
To spot a support and resistance area with the Footprint Chart is not that difficult. What you can also do is to use the normal chart and search for a support or resistance area in a higher timeframe and then search for the right entry with the Footprint Chart.
In the picture below you will see our discussed technique from the previous section. Look at the marked box and you will see exactly what the market does not want to trade lower. No one wants to sell on this price area in CL 53,90. The price is testing this area like 4 times before the reversal occurs.
What you have learned on this site:
There are even more strategies by using the Footprint Chart. On this page, we only showed you a short introduction to this chart type. It is very useful and easy to understand for beginners. First of all, you should practice this technique and learn how to read it. Furthermore, you can spot reversals with this chart type even better than without.
The advantages of the Footprint Chart:
- See what happens in the candle
- See why the market is moving
- Get more information than by using normal charts
- Spot better reversals
- Zoom into the markets
Professional Footprint Chart Book and PDF
A lot of traders are searching for information material for order flow trading. From our experience, there is not so much knowledge on the internet and some gurus sell the basics for more than thousands of US Dollars. That’s why our professional Trader Peter Becker wrote a complete book about the Footprint Chart. It is not expensive and everyone can buy it.
You will find more knowledge and strategies in this new book. Click the button below to buy his book as a PDF or print version. You can also visit his website: https://www.footprint-trading.com/

Your advantages for only $9,99:
- Learn how the footprint chart is working
- Detailed explanation for beginners
- 2 complete trading strategies (continuation and reversal)
- Learn about Delta
- Learn about Delta Profile
- Meaning of time frames in trading
We recommend: Use a combination of tools
In this last section, we will give you some tips about creating a good order flow workstation and find the right trades. It is possible to use the Footprint Chart as one chart and make a profit but from our experience, the combination of more tools and charts can be helpful.
Scalpers and day traders are using the Footprint chart as a solo chart. Trades are made within seconds and the profit and loss are few ticks. We recommend building trading strategies by using more than one chart. The combination of different tools is very powerful.
For example, you can use the Footprint Chart to get an exact entry for your trades. The execution can be made by the order book which shows you the limit orders and liquidity. For a long-term analysis, you can use the normal chart with the time periods 1 hour or 1 day. The combination of different charts is very powerful.
We recommend:
- Use the Footprint Chart for exact entries
- Combine the Footprint Chart with different tools
- The normal candlestick chart can be used for a long-term analysis
- Use the order book for a fast execution
- Develop a trading strategy with strict rules
To use the Footprint Chart is most of the time necessary for any professional day trader or scalp trader. You gain more advantages than normal chart traders  (5 / 5)
Trusted Broker Reviews
Experienced traders since 2013FAQs- The most asked questions about Footprint Charts:
How are footprint charts used in trading?
For every value, the footprint offers a glimpse of a bid x ask exchange. Buyers and sellers trade with one another for each price. A footprint’s job is to reveal information concerning how much quantity has been exchanged on both the purchaser’s and seller’s end.
How does a footprint chart define absorption?
Absorption is a situation where there is an abnormally large trade volume around the highs or lows of the bars in the lack or minimal change of the value behind the barrier. The optimum variation is the patterns of higher-than-normal volumes showing up at the supports and resistances level.
How should I interpret the bid/ask footprint chart?
It only displays the overall volume of contracts exchanged at each value, regardless of ask or bid. So, for instance, if your Bid X Ask Footprints is 500 x 900, the Volume Footprints will display you a value of 1400, whereas Delta will display 500.
What is the meaning of imbalances on the footprint graph?
The footprint imbalances graph shows the pricing thresholds when a purchase transaction volume exceeds a sell transaction volume. Diagonal bid/ask imbalances shows strong purchase market orders raising the offers and extreme sell market order lowering them.
See other articles about online brokers:
Last Updated on January 27, 2023 by Arkady Müller