Doji Candlestick: Understanding trading formation & strategy
Table of Contents
Buy and sell decisions in trading can be made quickly on the basis of gut instinct. However, this does not lead to success in the long term. In the long run, trading on the stock exchange is only crowned with success if there is also a strategy behind one’s own investment decisions. For this, well-founded analyses and their interpretations are necessary.
Traders can use a variety of tools, including the chart technique. One type of chart technique is the candlestick chart. One of the candles is called Doji. But what is behind it? The significance, definition, and how to interpret the Doji Candlestick will be clear below.
See the theory example of Doji Candlesticks here:

How do you recognize the Doji Candlestick?
To recognize the Doji in a candlestick chart, it is first important to understand the candlestick chart as a whole. In general, it is possible to map price trends with a chart and thus graphically extract indicators for further price trends. The charts thus serve to analyze and interpret the price development of an investment or a market.
Traders usually have the choice of which type of chart they would like to select. The bar chart or line chart is especially popular for beginners, as the chart types are easy to read and understand. Candlestick charts, however, offer much more information for analysis, which is why professional investors prefer to use this chart. Therefore, in order to understand the Doji, the candlestick chart will be explained first below.
Candlestick Chart: A brief overview
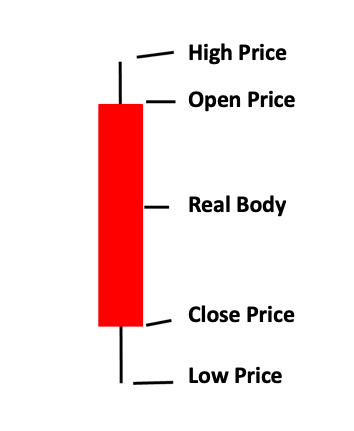
With a candlestick, it is possible to display price developments of derivatives, securities, and a currency. Not only the rise and fall of prices are shown in the individual candles, but also other information can be read from them. These are:
- Opening and closing price
- Highest price
- Low price
Bullish Candlestick (long):

Bearish Candlestick (short):

Again and again, you will hear the terms bulls and bears in the candlestick chart technique. Bulls denote the bullish candles and bear the bearish candle. Bulls stand for buyers in trading, while bears stand for sellers. These types of candles indicate whether the spread between the opening price and the closing price is rather close or far away.
But what if such a spread does not exist? This is always the case when the candle closes at a price similar to or equal to the opening price. This is also known as a Doji.
The best brokers for traders in our comparisons – get professional trading conditions with a regulated broker:
Broker: | Review: | Advantages: | Free account: |
|---|---|---|---|
1. Capital.com  | # Spreads from 0.0 pips # No commissions # Best platform for beginners # No hidden fees # More than 3,000+ markets | Live account from $ 20: (Risk warning: 70% of retail CFD accounts lose money) | |
2. RoboForex  | # High leverage up to 1:2000 # Free bonus # ECN accounts # MT4/MT5 # Crypto deposit/withdrawal | Live account from $ 10 (Risk warning: Your capital can be at risk) | |
3. Vantage Markets  | # High leverage up to 1:500 # High liquidity # No requotes # MT4/MT5 # Spreads from 0.0 pips | Live account from $ 200 (Risk warning: Your capital can be at risk) |
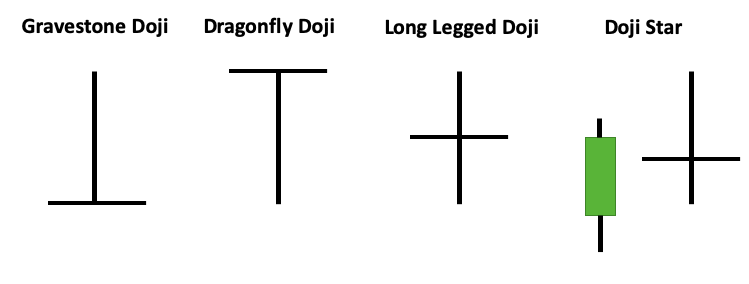
Four Doji candlestick types differ:
Thus, a Doji indicates that the price level between the opening and closing price is almost identical or even the same. This type of price movement conveys indecision.
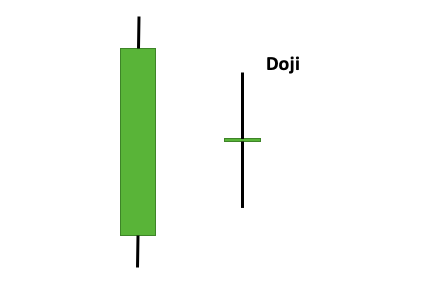
And how do you recognize a Doji? While normal candlesticks always consist of a candlestick body and a candlestick wick, the candlestick body is almost minimal or almost unrecognizable. This can be seen well in the following chart.
However, a dog is not always a Doji. The Doji candle has therefore also variations between which is distinguished. Which variation it is, is clear from the shape and position of the Doji. What are the differences between the formations will be clear below.

Gravestone Doji (Gravestone)
A Gravestone-Doji is an important signal for traders. Whenever a Gravestone-Doji appears, it means that the current uptrend of the asset class is over. Signals like this, are therefore essential to pay attention to when trading. A trend reversal could take place.
Dragonfly-Doji (Dragonfly)
The opposite of the Gravestone Doji is the Dragonfly Doji. This one indicates that a downtrend is over. Instead, a break occurs and rising price developments can be expected. Here it is, therefore, worthwhile to enter as a buyer.
Long-Legged-Doji (Long Legged)
While the Gravestone- and the Dragonfly-Doji indicate clear price breaks, the Long-Legged-Doji is an indication of strong price developments. Therefore, the Long-Legged-Doji as formations indicates that there is currently no clear direction in the price. Price fluctuations occur in the market. Thus, entering the market at this time would be associated with increased risk for traders.
Standard or Star Doji (Star)
Finally, there is the star Doji. This is always seen when opening with a price gap. Thus, the Doji is separated from the pre-candle. Again, a distinction must be made between the bearish and bullish variants of the candlesticks. A bullish Doji Star is positioned below the pre-candle in the candlestick chart, while the Doji in the bearish variant is positioned above the pre-candle.
The star Doji is often a sign of a trend reversal. Both an uptrend and a downtrend in prices could result from it. However, it is usually a sign of falling prices.
In general, a Doji can be described as a stalemate between bulls and bears. In order to analyze the star Doji even better, a distinction is made between three types:
- Evening-Doji-Star: Forecasts a rise in prices of the markets.
- Morning-Doji-Star: Forecasts a fall in the prices of the markets
- Shooting-Star formations: Upward trend, due to falling prices
Trade more than 3,000+ markets from 0.0 pips spread without commissions and professional platforms:
(Risk warning: 70% of retail CFD accounts lose money)
Doji indicates price reversals
What a Doji candle is, is now clear. As one of the candles of a candlestick chart, a Doji allows an even better analysis of the current price situation and often indicates a trend change. Thus, when the closing price and the opening price are close to each other, it is important to take a closer look at the current market to sense a trend.

Trading strategy with the Doji formation
Candlestick charts in general can be a helpful analytical tool in trading. However, special attention should be paid to the Doji candlestick. The sign of indecision and thus a stalemate between buyers and sellers is an exciting indicator of analysis in trading. If you do not recognize a Doji in a candlestick chart, you could make wrong analyses and thus also wrong investment decisions. Thus, a Doji always occurs when prices are almost the same between the open and the close.
This is usually the case in trending markets. There it can come more often to a Doji since trends change now once again and again.
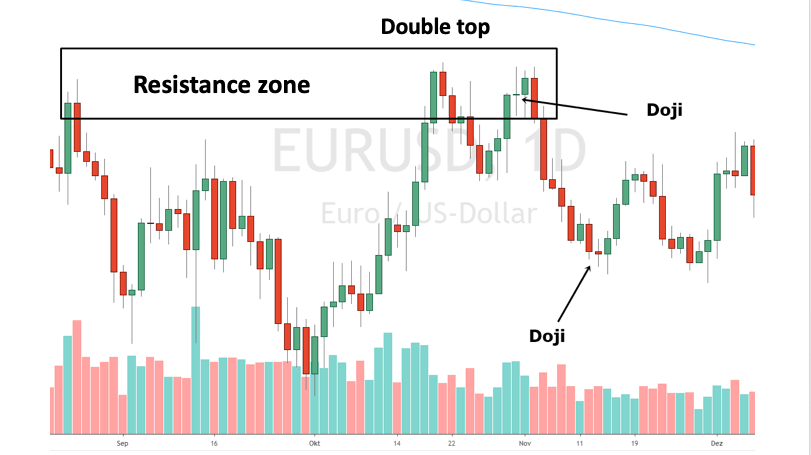
In the picture below you can see an example of a dog and a chart analysis. We will take a closer look at the example:

In the picture above you can see the candlestick chart with a resistance zone drawn in. This is a price that is rejected by market participants. The price is too expensive there and many traders want to sell there. In the past, the price has tested this spot several times.
Now you can see a Doji formation at a high. A double top is forming. With the combination of the resistance zone and the entry signal Doji, we could have made a profitable short trade here. A trading strategy should never consist of a Doji alone. The trader must include the current price, chart analysis, and also fundamental data.
Likewise, we recognize that the downtrend is stopped by a Doji with a small candle body. The Doji can also be used as an exit signal for existing positions.
Trade more than 3,000+ markets from 0.0 pips spread without commissions and professional platforms:
(Risk warning: 70% of retail CFD accounts lose money)
Is a Doji considered a trading signal?
A Doji is a valid signal in trading, which should influence investment decisions. However, a distinction must be made between markets. While a Doji is a good indication of changes in a trending market, the significance of the indicator is usually not so great in ranging markets. In ranging markets, they are not always reliable and can thus lead to a distortion of supply and demand.
Thus, when trading stocks, the Doji is a very good indicator in volatile markets. The probability that a Doji indicates a change in trend is extremely high in these markets.

Conclusion on the Doji: Helpful chart formation for entries and exits
Who often trades on the stock market, should at least understand what it is about a Doji Candlestick, because it contains important information and thus forecasts and shows you profits through the correct analysis of the respective price. A Doji can be displayed in candlestick charts of different asset classes and always represents a similar development of the opening and closing prices. By the type of the Doji traders can recognize whether it is a positive or negative trend reversal or whether the prices are fluctuating strongly.
Trade more than 3,000+ markets from 0.0 pips spread without commissions and professional platforms:
(Risk warning: 70% of retail CFD accounts lose money)
FAQ – The most asked questions about Doji Candlestick:
What is a Doji candlestick pattern?
Doji candlestick is a neutral indicator that gives less and rare information for which they are not well founded for spotting price reversals. Doji candlestick pattern comes in four major types:
Gravestone Doji
Dragonfly Doji
Long-legged Doji
Doji star
Is the Doji pattern bullish?
The Doji candlestick pattern is not bullish even though Doji means blunder or mistake. Advanced traders use different types of candlestick patterns, of which Doji is one. It mostly appears during a downtrend or uptrend, resulting in inequality between bearish and optimistic.
What does 2 Doji mean?
In the Doji candlestick pattern, a single Doji is a good indication of indecision. 2 Doji is a greater indication that results in a high-intensity breakout. The 2 Doji or double Doji method takes advantage of the intense directional move that unfolds after the indecision period.
How do you create a Doji candlestick?
A Doji candlestick is created when the trading market opens and bullish traders raise the price. At that point, bearish traders reject the higher value and push them back down. It might also happen that bearish traders try to push down the prices as low as possible and urge bull to fight back to raise their prices.
See other article about trading:
Last Updated on January 27, 2023 by Arkady Müller

 (5 / 5)
Leave a Reply
Want to join the discussion?Feel free to contribute!