The best candlestick patterns for binary options – Strategy explained
Table of Contents
Binary options are a great way to make money. But, without the right strategy, you will lose your investment in no time. This binary options candlestick strategy is for those looking to trade binary options with success. We have compiled the best candlestick patterns that traders should be aware of before they start trading or investing any funds in this market. You’ll also learn how these patterns work and why they are so important when it comes to making trades on binary options platforms.
What is a candlestick chart?
A candlestick chart is a financial chart that shows the trading session (day, week or month, etc.) as a vertical bar. The top of the candle represents the opening price, and the bottom represents the closing price. The vertical line that extends from the top represents the high price and the bottom line low. These lines are called shadows or wicks.
The candlestick is composed of two points: open-close (OC), which determines how much an asset has changed during one day/week/month etc., high -low (HL), which shows at what level prices reached their highest point and lowest, respectively. Investors need to understand this information because it tells them if they should buy, sell, take profits, or hold out longer.
What is a candlestick pattern?
A candlestick pattern is a graphical representation that traders can employ to identify and predict market trends. The candlestick pattern contains information about the opening and closing price, as well as the high and low. This information can be used by traders to make more profitable trades, as well as take advantage of short-term trends.
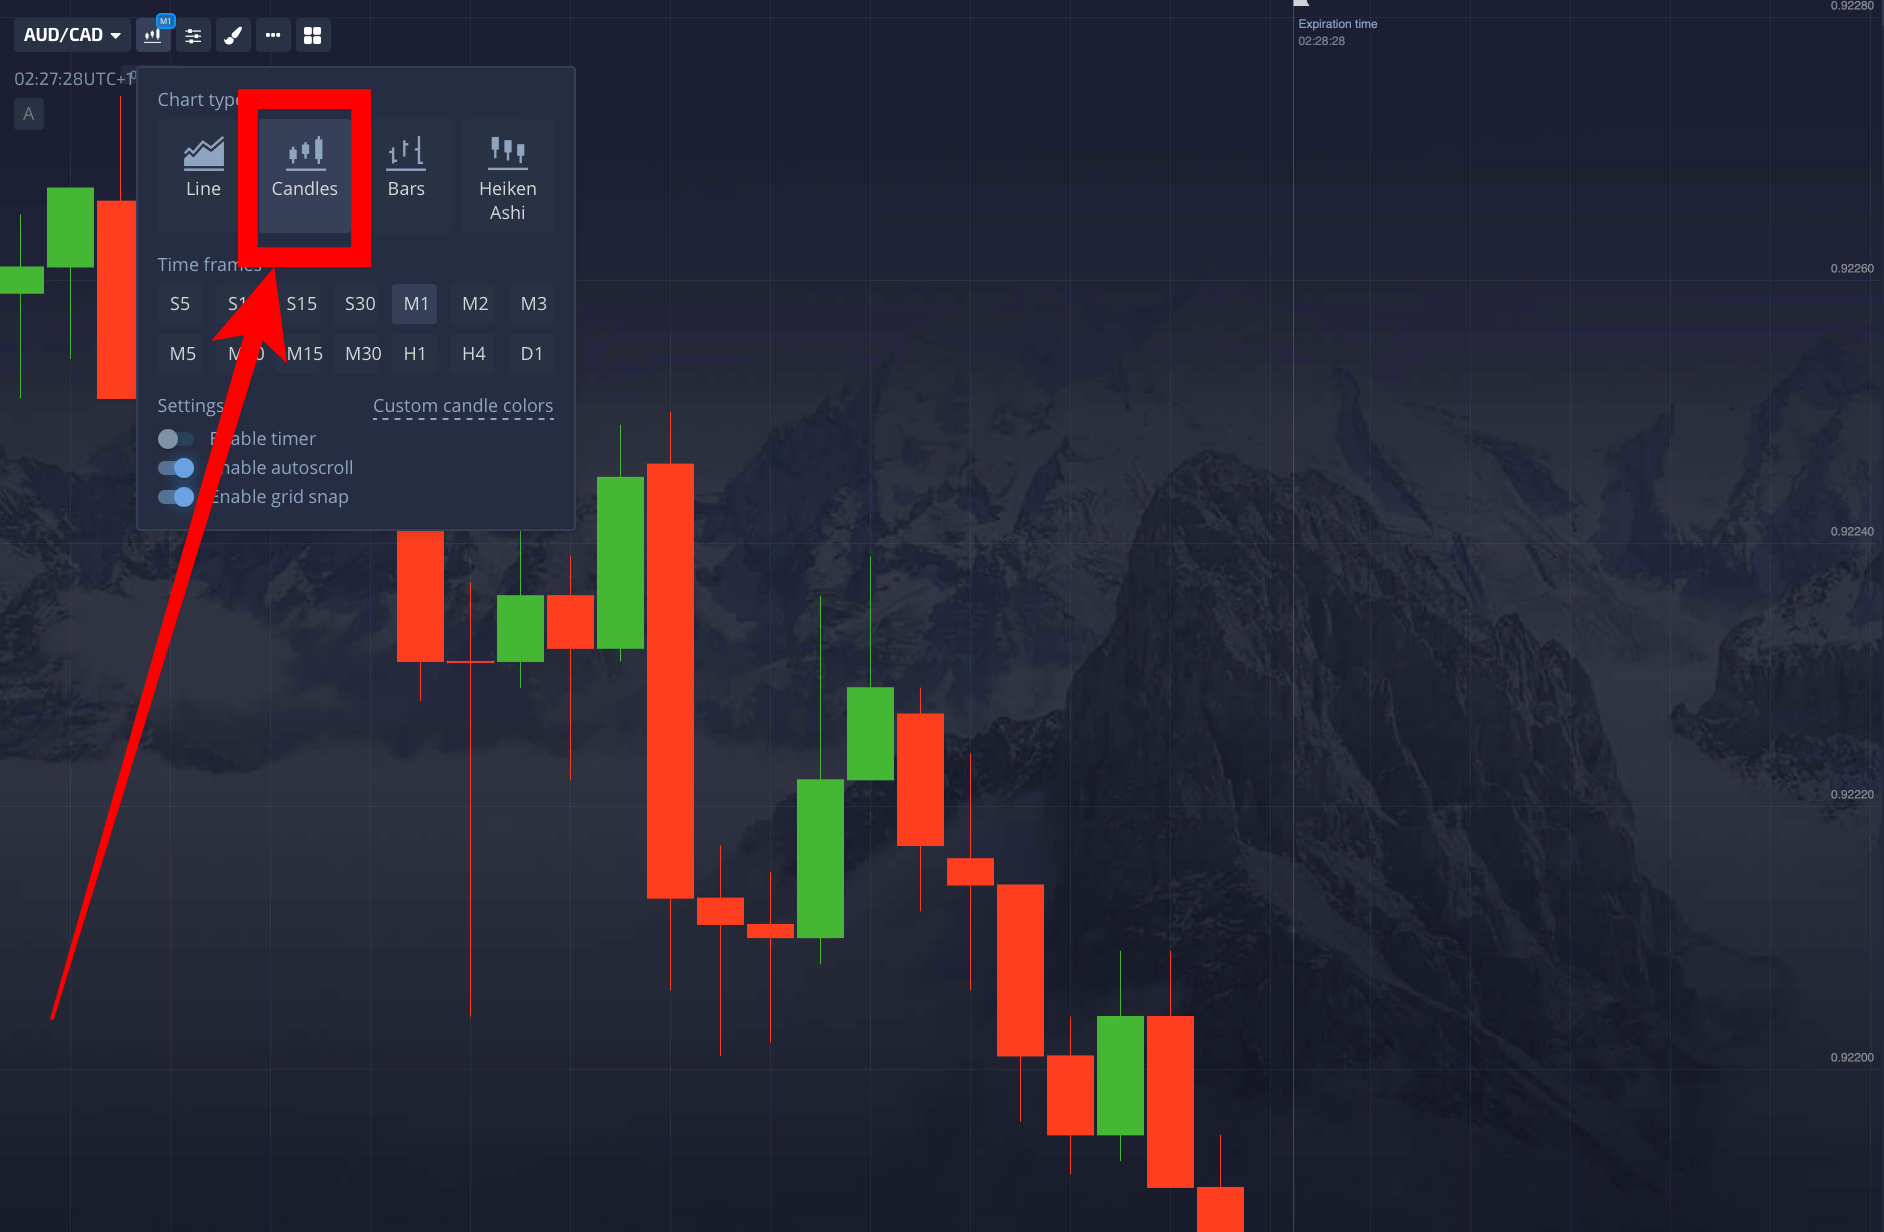
Candlestick charts and patterns are commonly used in the stock market and can also be applied to Forex, CFDs, or Binary Options. Candlestick charts consist of a rectangle representing the range between open and closed prices for each period (candlestick). The bottom of the rectangle is called “open,” and the top part is called “close.” These candles can be green or red. The color of the candle depends on whether the closing price is higher than the opening price (green) or lower than the opening price (red).
Candlestick Patterns provide an easy way to spot trends, especially in Forex markets where volatility plays a significant role in the price movement. In binary options, these patterns can be used as signals for potential trades based on which direction you think those assets will move towards, i.e., the Call/Put option at the expiry time.
How candlestick patterns work
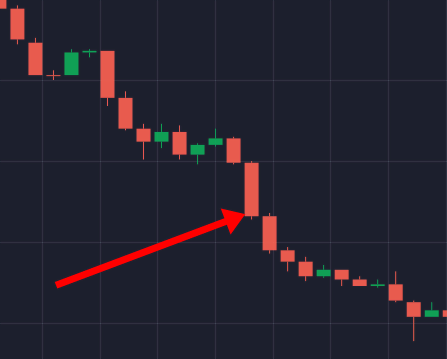
Candlestick patterns work by predicting the future direction of a stock price. The candlesticks form when the opening and closing prices for a certain period are compared with the previous period’s opening and closing prices. The contrast between these four values provides information about potential market trends. This information is more reliable when the open and closing prices are closer, as with pin bars.
Japanese candlestick charts explained
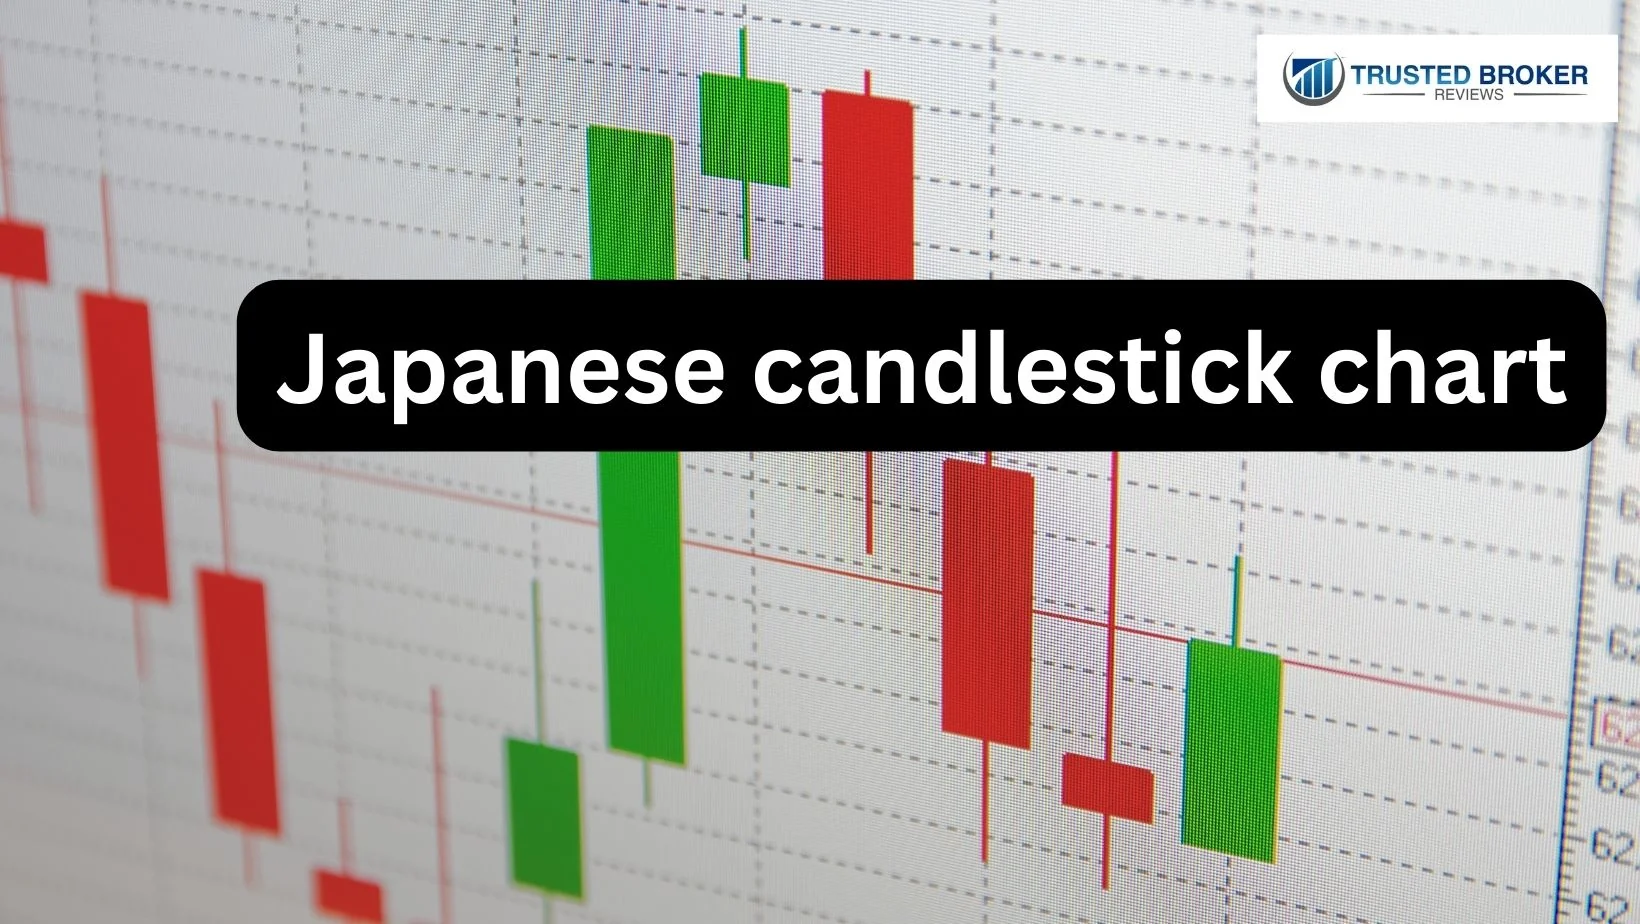
The Japanese Candlestick Charts are a time-based candlestick charting technique to determine market sentiment from prices. It is a graphical representation of the difference between an asset’s opening and closing prices. To find the difference between an asset’s opening and closing prices, you must first calculate the highs and lows throughout a specific timeframe. From these highs and lows, you can form a rectangle by connecting them with lines.
The width of this rectangle will represent the highest price minus the lowest price during that period. The difference in length of the lines on the top and bottom of the rectangle will represent whether it closed at a higher or lower price than what it opened at. A green line on top of the rectangle will indicate that it opened lower and closed higher, while a red line on the bottom of the rectangle would mean that it opened at a high price and then dropped to close at a low price.
The Japanese Candlestick Charts are significant for Binary Options traders because they can help determine whether or not their trade has a high probability of success.
Candlestick binary options strategies:
There are many different types of Candlestick patterns out there. Still, when it comes to making trades on Binary Options, you should stick with these specific ones because they have proven time after time again to be very profitable for traders who use them correctly. You can see all our recommended common candlestick patterns using a binary options candlestick strategy below.
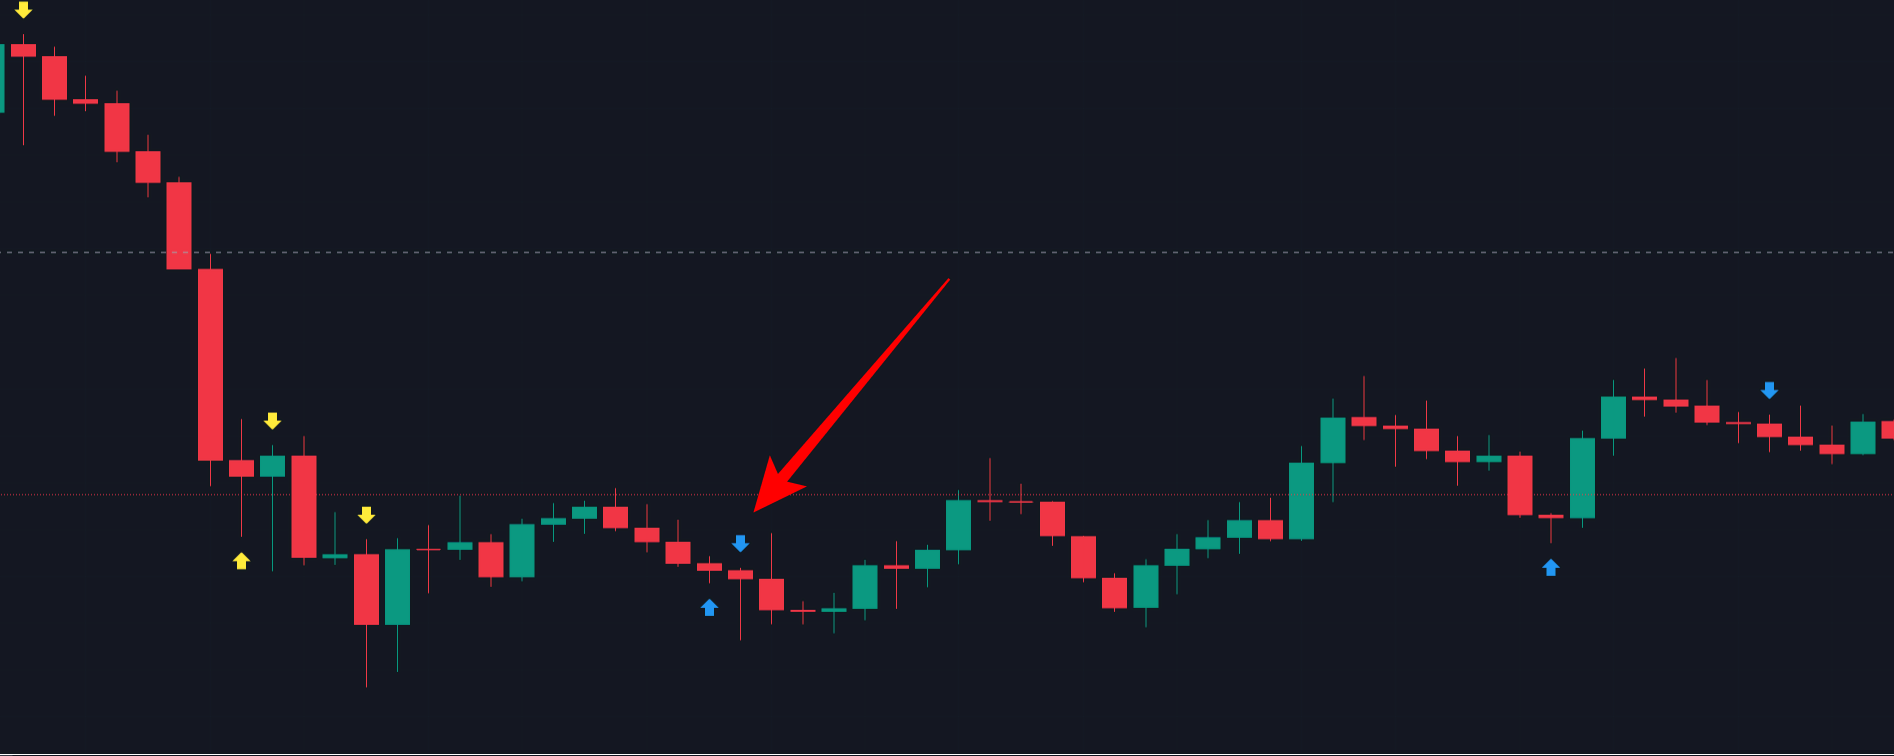
1. Pin bars

A “Pin Bar” form is a type of candlestick that forms when there is a slight difference between the open and closed prices that happen within the same time frame.
The Pin Bar is composed of three points: the open, the close, and the upper shadow. The first two points are usually minimal, while the third one is much longer, which means that it extends well beyond what was considered to be a normal range for prices during this given time frame. The Pin Bars indicate a potential reversal of the trend or continuation of the current trend.”
Pin Bar patterns are easy to spot on a chart due to their long shadows. When trading using a binary options candlestick strategy that uses these patterns, it’s essential to be aware of the height of the bar relative to its length. If this ratio is high, then there may not have been much movement in price, so you should consider waiting for another signal before placing your trade. On the other hand, if ratios between these two values are low, it indicates strong momentum. This knowledge can help traders decide whether to place a Call or Put trade.
Good to know!
If you’re not sure if a rational or irrational belief causes your procrastination, try out different things to see what works! One way to change procrastination caused by an irrational belief could be to identify situations and rewards causing you to procrastinate.
Pin bars are one of our favorite binary options trading patterns because it is the most consistent in binary options trading. The pin bar is straightforward to identify and therefore offers great potential for some significant profits. Pin bars are candlesticks with a meager open price, followed by a single high-low candle that closes near the high price of the previous candlestick.
They are also called “long shadows” because they have long prices at both ends. This means that buyers are more likely to buy when these candlesticks appear on their charts because the prices increase.
The minimum requirement for a pin bar is an opening price lower than the opening price of the previous candlestick, followed by a high-low candle that closes higher than the opening price.
2. Engulfing candle

Engulfing is a reversal candlestick pattern that indicates a reversal in the trend.
The Engulfing occurs when the price of the asset opens at a high level, then falls sharply lower before making a sharp rise back to or above its opening price.
In other words, this is what happens:
- The stock has been trading in a downtrend for some time
- The market opens at a higher price than it’s been trading over the past few days
- The stock falls sharply and closes near or below its open.
- The market then reopens and trades higher than it opened on that day.
- The engulfing is a compelling bullish pattern.
When the market opens higher than its previous close and then closes even higher, chances are very high that this will be followed by a significant price move in the same direction as the trend (which was previously bearish).
This candlestick candle usually occurs at the bottom of a downtrend and signals that the price is ready to start moving up again.
The engulfing frequently occurs in actual trading, but it’s still difficult for beginners due to its complexity.
It requires detailed market analysis knowledge and technical analysis experience, so most traders would instead leave this one alone until they’ve mastered the basics.
If you’re a beginner, it’s best to avoid trading this pattern until you’ve got some experience under your belt.
3. Piercing
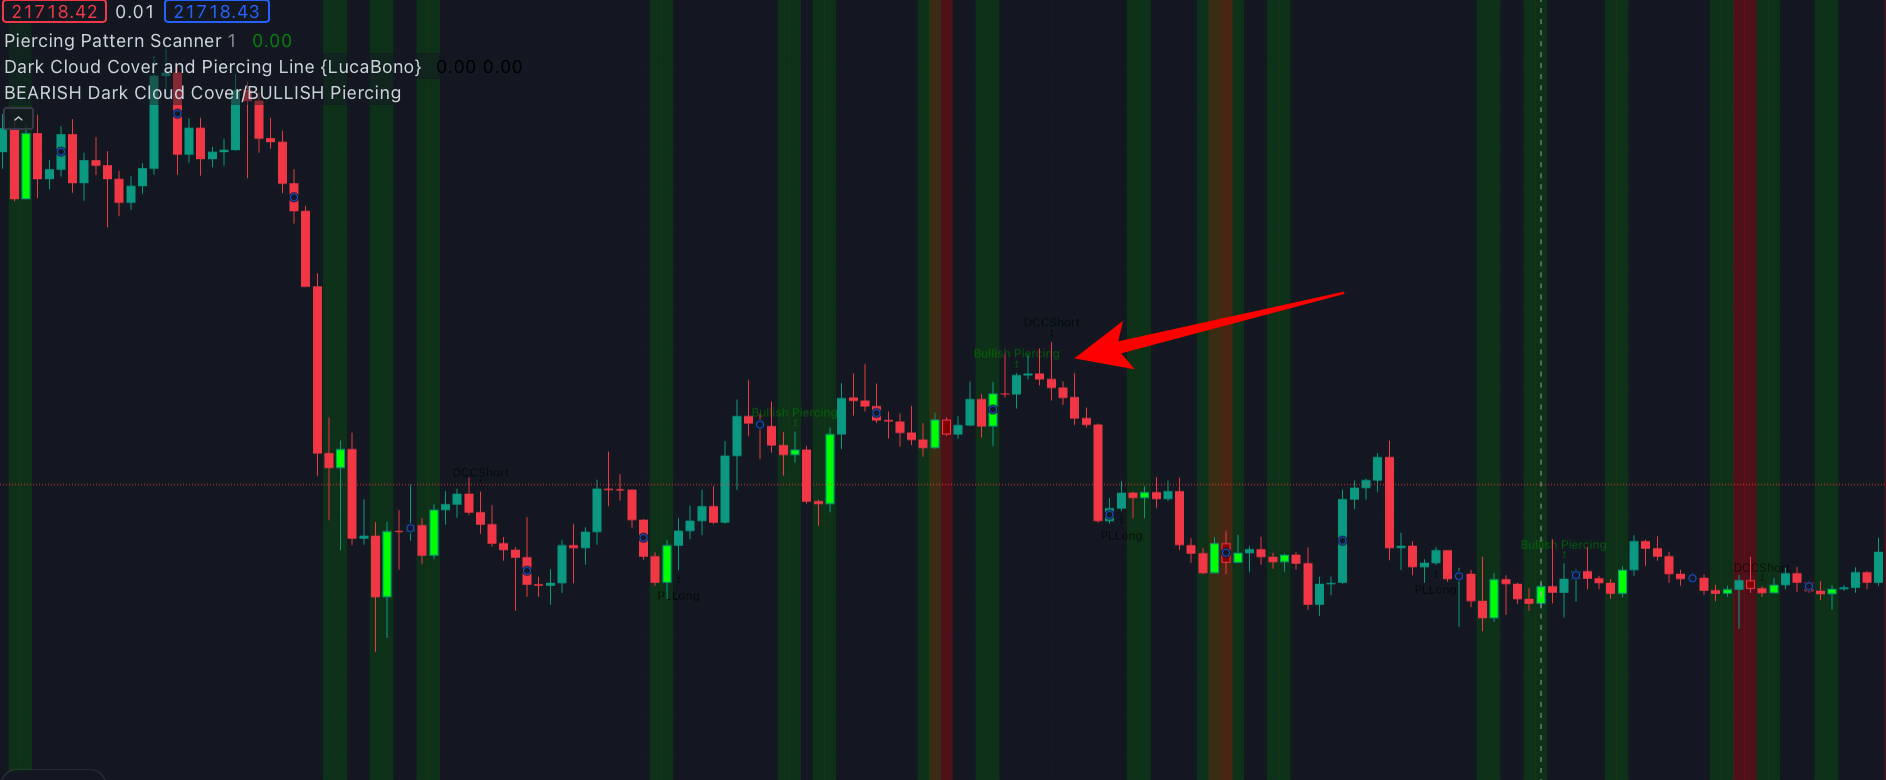
A Piercing candlestick pattern is a generic term that describes a bar that pierces the previous bar high and low. These Patterns are not rare in binary options trading. When we see a Piercing, we must pay attention to the direction of the piercing candlestick. If the piercing candlestick pierces upwards, this implies that the price is likely to continue increasing. If the price falls on a low penetration, it indicates that the price will most likely continue to drop. In addition, the Piercing formation can appear in various patterns. Some examples include Piercing Line Candle, Dark Cloud Cover Candle, and Morning Star Candlestick.
4. Morning star

Morning Star is a specific type of Piercing Candlestick Patterns. This pattern is formed when a small natural body opens at or near the low, which then gaps up to reveal a long red candlestick with a small natural body- this large candlestick pierces the previous bar high and low. If the Piercing is bullish, an entry should occur at or near the low of the Piercing.
The Morning Star candlestick formation indicates that the market will rebound after a price decline. As a result, it’s conceivable that determining whether the price will rise or fall from its lows is more complex than predicting whether the price will rise or fall from its highs.
Some traders believe that the bullish version of the Morning Star is more reliable than a bearish one. If there are two consecutive Doji’s, it may suggest a trend reversal, but only if they appear at resistance levels and not support ones.
5. Dark cloud cover
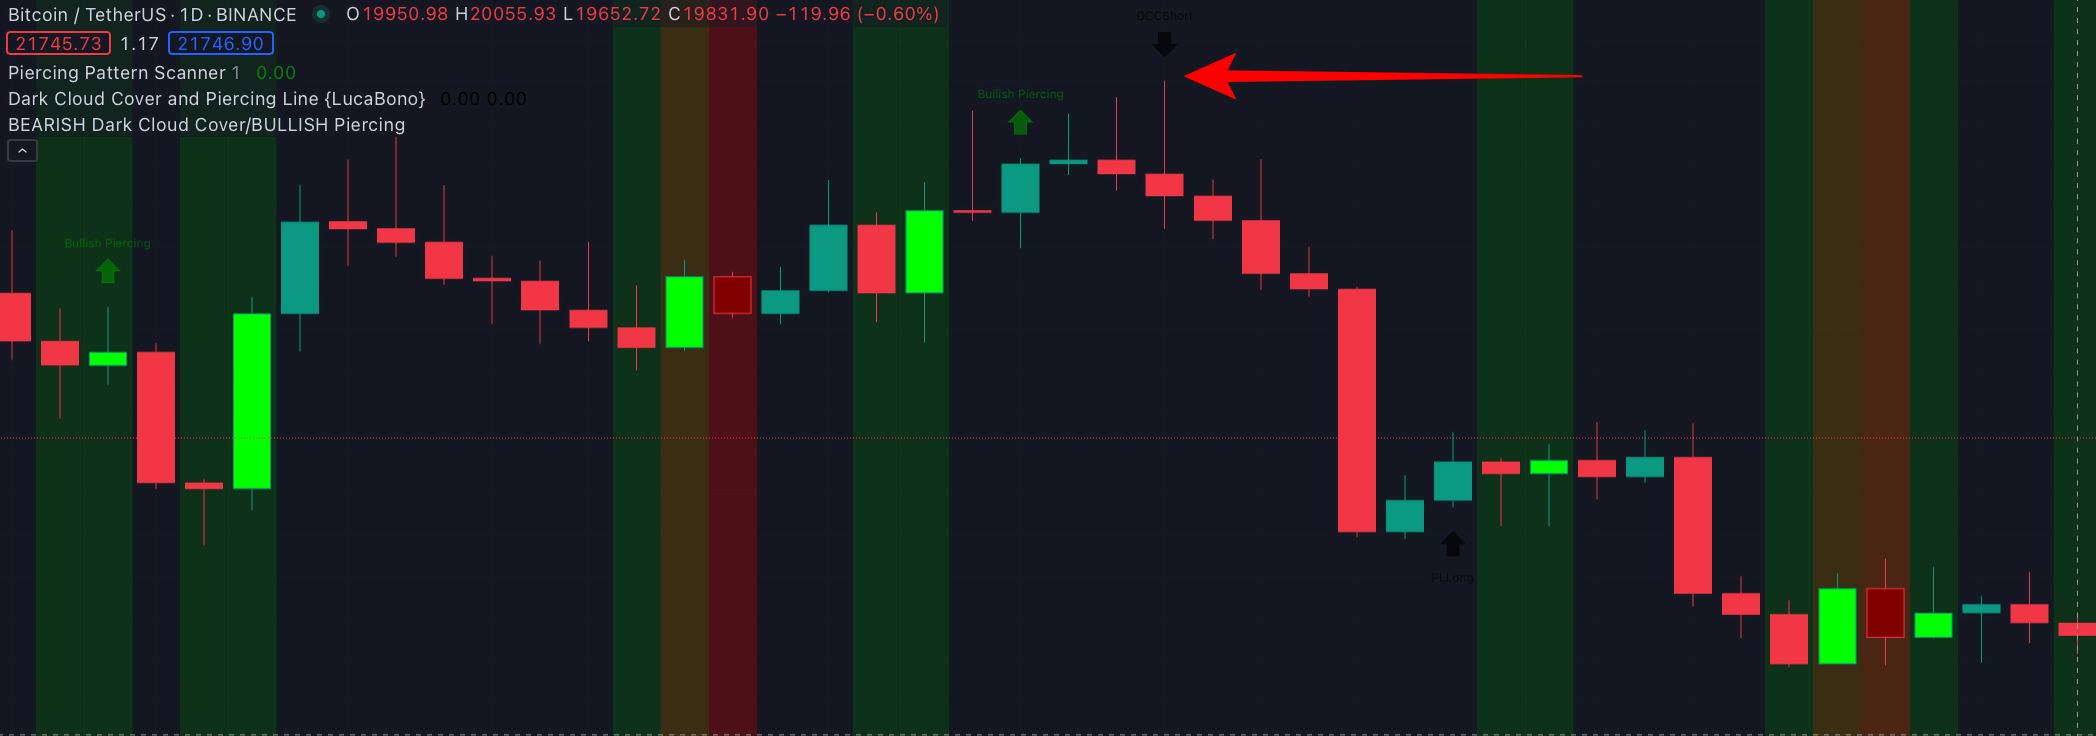
A dark cloud cover is a candlestick pattern that indicates that the traders are trying to implement buy strategies. The market has been open for quite some time, and most traders may be bullish on the current stock prices. Candlesticks tend to form bullish patterns when there is high-volume trading for at least two days in a row. This is often an early warning sign for investors to take their profits off the table, especially if they have not reached their target price.
The patterns of the Dark Cloud Cover should be closely monitored. When these patterns appear within a bearish market, they should be regarded as significant warning signals of future dangers or losses.
6. The hammer
The hammer candlestick is a bullish reversal pattern that is the opposite of the engulfing. It occurs when the asset’s price opens lower than its previous close, then trades higher than its opening price.
The anatomy of this type of candlestick includes a long thin green body on top with an upper shadow and lower shadow extending below the body. The opening price must be below the closing price, but not by much.
Good to know!
This candlestick formation is an early signal of a potential bullish turnaround.
However, if it appears after a long trade period in one direction, it predicts that the trend will continue into the near future without any reversal for now.
7. Inverted hammer

An example of the Inverted Hammer candlestick pattern is when there is a long bearish trend, and it reverses and shoots upwards. When this happens, it looks like an “inverted hammer” in the sense that the top part of the candle is short and the bottom part of the candle is long.
This pattern is seen as an indication that the bearish sentiment has been temporarily overridden by bullish sentiment. The result of this is usually a price increase. It is a signal that the price of an asset will increase and may continue to do so.
The inverted hammer may also be utilized as a part of a binary options candlestick strategy, such as in the Bollinger Bands method. It has been discovered that if you make long bets at this time, your chances of winning trades are high. It is also known as an “Evening Star.” This occurs when there are a lot of tiny blue or green candles, and then another candle (the star) gaps down the following day. Typically, this is followed by a strong upswing.
Good to know!
In addition, the Inverted Hammer might also be utilized as a part of an inside bar strategy, which is a trading approach in which you start long trades when the price passes above the open/close point for that candle (i.e., it breaks out).
8. Hanging Man

The Hanging Man consists of at least three candlesticks. The first candlestick must be a significant red candle that follows an up-move. The second candlestick must be the opposite (white or green); it must also be smaller in size than the first candle. Lastly, the third candlestick must be white or green, and it should close outside the second candlestick’s body.
These patterns are said to represent uncertainty when they form in a market environment where there is high momentum. Some traders consider this to signify an increased potential for either higher highs or lower lows in prices shortly.
9. Shooting Star

When there is a long bearish trend, the Shooting Star candlestick pattern occurs. In this case, it appears to be an “inverted hammer” because the top of the candle is short, and the bottom of the candle is long.
Good to know!
This pattern is interpreted as a sign that bearish sentiment has been temporarily overcome by bullish sentiments. As a result, the price typically rises. It’s an indication that the price of an asset will rise and perhaps accelerate.
The Shooting Star can also be used as part of a candlestick strategy for Binary Options, such as in Bollinger Bands strategies. It has been found that if you enter into short trades at this point, then there is a high chance that your trade will be successful. It is also known as an “Evening Doji Star.” This occurs when there are a lot of little green or blue candles, followed by another candle (the star) that gaps down the next day. This is generally followed by a substantial upswing.
This technique can also be used as part of an inside bar strategy, which involves entering short trades when the price moves below the open/close point for that candle (i.e., it breaks out).
10. Doji

Dojis are the most common form of candlestick patterns, comprising two candles with short shadows or bodies that appear around the same price. Dojis are not significant by themselves but can signal a reversal or indecision in the market, with the next candle moving powerfully in one direction or another after it has formed. This movement is often swift and decisive, so Dojis should only be traded based on other candlestick signals, such as long-legged Dojis, dragonfly Dojis, or harami patterns.
Dojis are best suited for shorter-term trends lasting no longer than ten days and can be used to predict longer-term price swings. A bullish Doji predicts further upward movement after it has formed, while a bearish one warns of future downward movement once the trend reverses.
This is one of the most popular patterns among traders because, when used correctly, it can be very profitable.
11. Long-legged Doji

A long-legged Doji is classed as a continuation pattern. It is formed when the market opens and then has a small opening range with minimal price movement but finishes with a significant price movement in the same direction. The Doji’s long upper and lower shadows create the appearance of a plus sign. A bullish long-legged Doji is formed when prices open low and then rally to close near or at their high point, while the bearish counterpart forms when prices open high and then decline to finish near or at their low point. Long-legged Dojis also indicate that the same trends will continue.
Long-legged Doji candlestick patterns are best suited for longer-term trends lasting around ten or more days but can also be used to predict shorter-term price swings too. A bullish long-legged Doji predicts further upward movement, and a bearish one signals future downward movement after it has formed.
12. Dragonfly Doji

Dragonfly Doji is similar to long-legged Doji but with a more excellent range, and the shadows of the two candlesticks cannot overlap. The dragonfly Doji is used to indicate that the trend is slowing and may reverse soon. If the shadows of a dragonfly Doji cross and close within the upper shadow or lower shadow, it is more likely to be followed by further price movement in that direction. If not, then expect an immediate reversal, with prices moving against this trend.
Dragonfly Doji is best suited for shorter-term trends lasting no longer than ten days but can also be used to predict longer-term price swings. A bullish dragonfly Doji predicts further upward movement, and a bearish one signals future downward movement after it has formed.
13. Gravestone Doji

A gravestone Doji, also known as a “dead cross” or “death cross,” is an evening star pattern with the opening and closing of the candlestick almost equal. This pattern is significant for binary options traders because it can mean that the price has come to rest at its low point after having declined.
When a trader anticipates a significant price decline, gravestone Dojis are ideal. The design is especially beneficial in predicting an uptrend’s reversal. It may be regarded as a stronger signal than even the traditional evening star candlestick pattern, which forms during day trading.
A strong gravestone-Doji is formed after there has been selling pressure on markets overnight, as the price falls to a certain level and then opens at that same level before falling even lower during daytime trading. This is evidence of intense selling pressure from traders looking for an opportunity to open new positions or close out existing ones on weak prices.
Breakout trading with binary options and candlesticks:
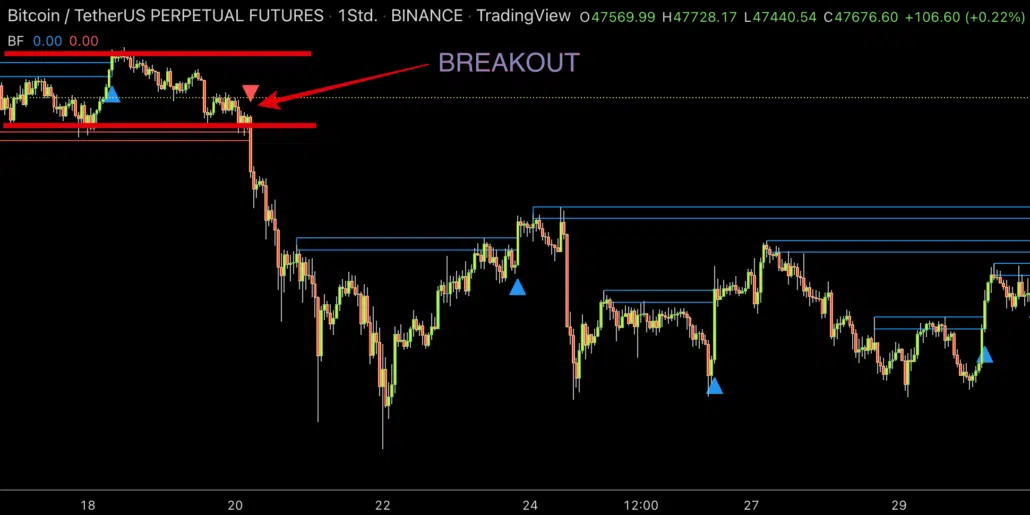
Breakout trading is a technical analysis used to analyze the price charts of various assets. It’s typically used to identify potential trends with higher probability. These breaks are usually associated with the asset starting to trend upwards with stronger momentum or downwards with weaker momentum.
The purpose of breakout trading is to take advantage of these momentum changes by buying at the bottom and selling at the top. If this technique works, traders will see their losses reversed.
This is often referred to as “going with the trend.” However, it’s important not to get carried away. You should only go with a certain amount of strength or momentum behind an asset. If you try to trade too early, then this will more than likely result in losses instead of gains because you’re missing out on potential profits while trying to jump onto the train when it’s already moving at top speed!
Breakout trading works best for longer-term traders that are looking for bigger profits over time rather than day trading, which requires constant monitoring of charts throughout the day; this makes breakout strategies quite popular among investors who like automation (binary options robots) since they can leave their strategy running without any oversight until they receive notification via email/text when a trade is made.
Fake breakouts
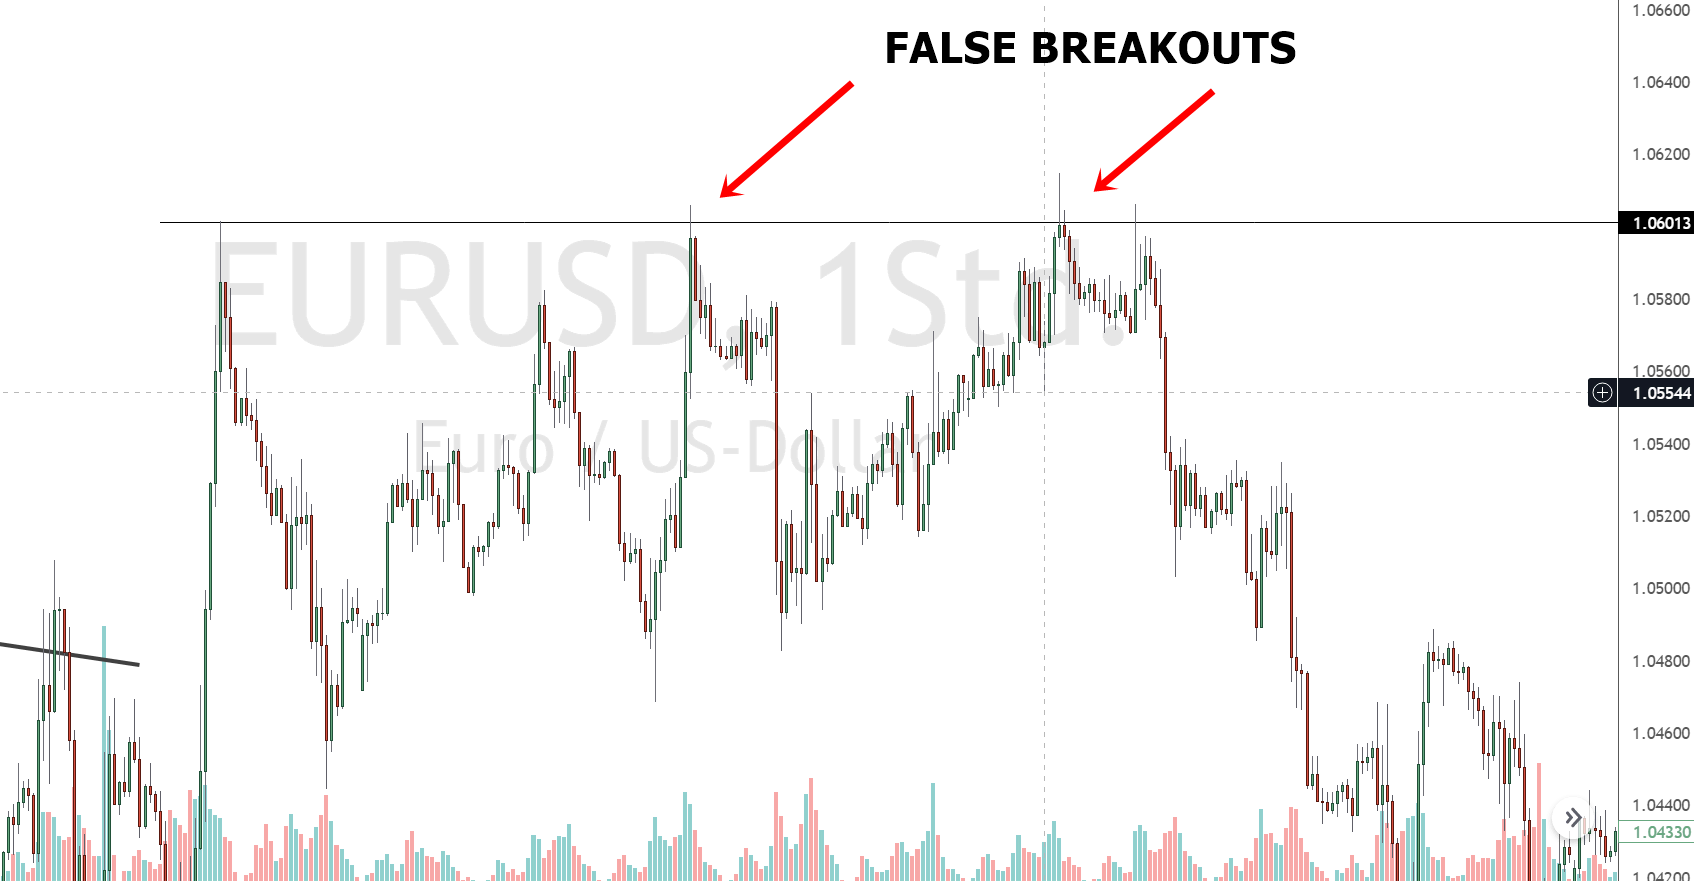
Fake Breakouts are a reversal pattern that is formed when the market opens and closes within the same or close proximity to its opening price. This pattern has a high probability of predicting a breakout in one direction or another, but the breakout will only happen once the stock has been allowed to trade for greater than 10 minutes. The Fake Breakouts are usually detected using the 1-Minute Time Frame and the 15-Minute Time Frame.
Pros of the candlestick patterns trading strategy
- One of the most profitable trading strategies for binary options
- High ROI on trades with minimal risk
- Candlesticks patterns are easy to spot, and time frames can be customized
Cons of the candlestick patterns trading strategy
- It’s really hard to find the patterns that are good for trading
- You will need to analyze more charts than you would with any other system
- What if your analysis is wrong?
Conclusion – Great strategies can help you to gain more profits in professional binary trading!
Candlestick trading is a popular strategy among binary options traders because it’s profitable and easy to spot. The candlesticks patterns are also easier to find on the charts than other strategies, so if you’re looking for an alternative way of spotting trends in your investments, this may be worth considering!
FAQ – Most asked questions about binary options and candlestick patterns:
What is the best strategy for binary options?
There is no best strategy for binary options. The best you can do is find a good trading system that fits your personality and risk tolerance.
How to trade candlesticks with binary options?
Candlestick patterns work just like they do in forex trading, but with binary options. You need to look for reversal signals rather than continuation ones. This is the only difference between the two markets.
Which candlestick pattern is most profitable?
There are many candlestick patterns with high-probability setups. The Doji is one of the most popular candlesticks patterns for trading binary options.
Which candlestick pattern is most dependable for which timeframes?
When discussing the ideal candlestick time frame for day trading, the 5-minute and 15-minute candlestick charts are the most often utilized time frames for intraday trading. The four points on the candlesticks, known as OHLC, are present (open, high, low, and close).
Which bullish candlestick pattern is the most effective?
It is observed that when the closing price is usually lower than the opening price, it is denoted as black or the whole candlestick is bearish, which indicates selling pressure. Simultaneously, a white or hollow candlestick indicates that the closing price exceeds the opening, indicating a purchase pressure.
How can you know whether a candlestick pattern is strong?
Two bullish candlesticks with a space between them make up the rising window, a type of candlestick pattern. There is a gap between the peak and low of two candlesticks because of the intense trading volatility. This one indicates a candlestick pattern that indicates a significant buying presence in the market.
Is the candlestick pattern reliable and trustworthy?
As its name indicates, a single candlestick pattern comprises just one candle. As you might expect, the trade signal is produced based on one day’s trading activity. As long as the pattern has been appropriately discovered and applied, trading based on a single candlestick pattern can be very successful.
See more articles about Binary Options trading:
Last Updated on April 14, 2023 by Andre Witzel