How to use the Volume Profile – explanation
Table of Contents
What is the Volume Profile and how to use it? – On this site, we will show you an exact explanation of the tool. The Volume Profile is very familiar with order flow trading. It is a simple tool provided by most trading platforms which are offering stock, bond, or futures trading. It can give you advantages over the market by analyzing the volume. In the next section, we will give you instructions and show some successful trading strategies.
What is the Volume Profile?
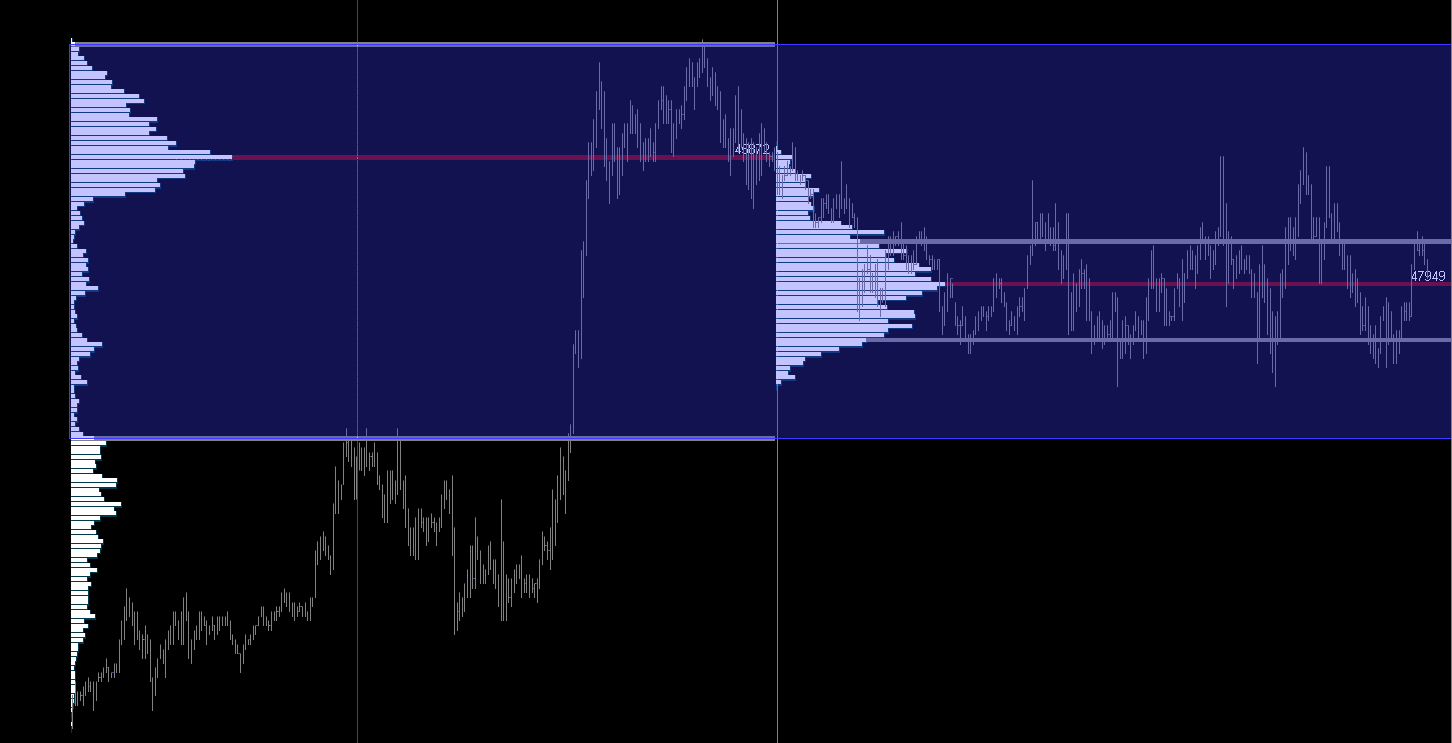
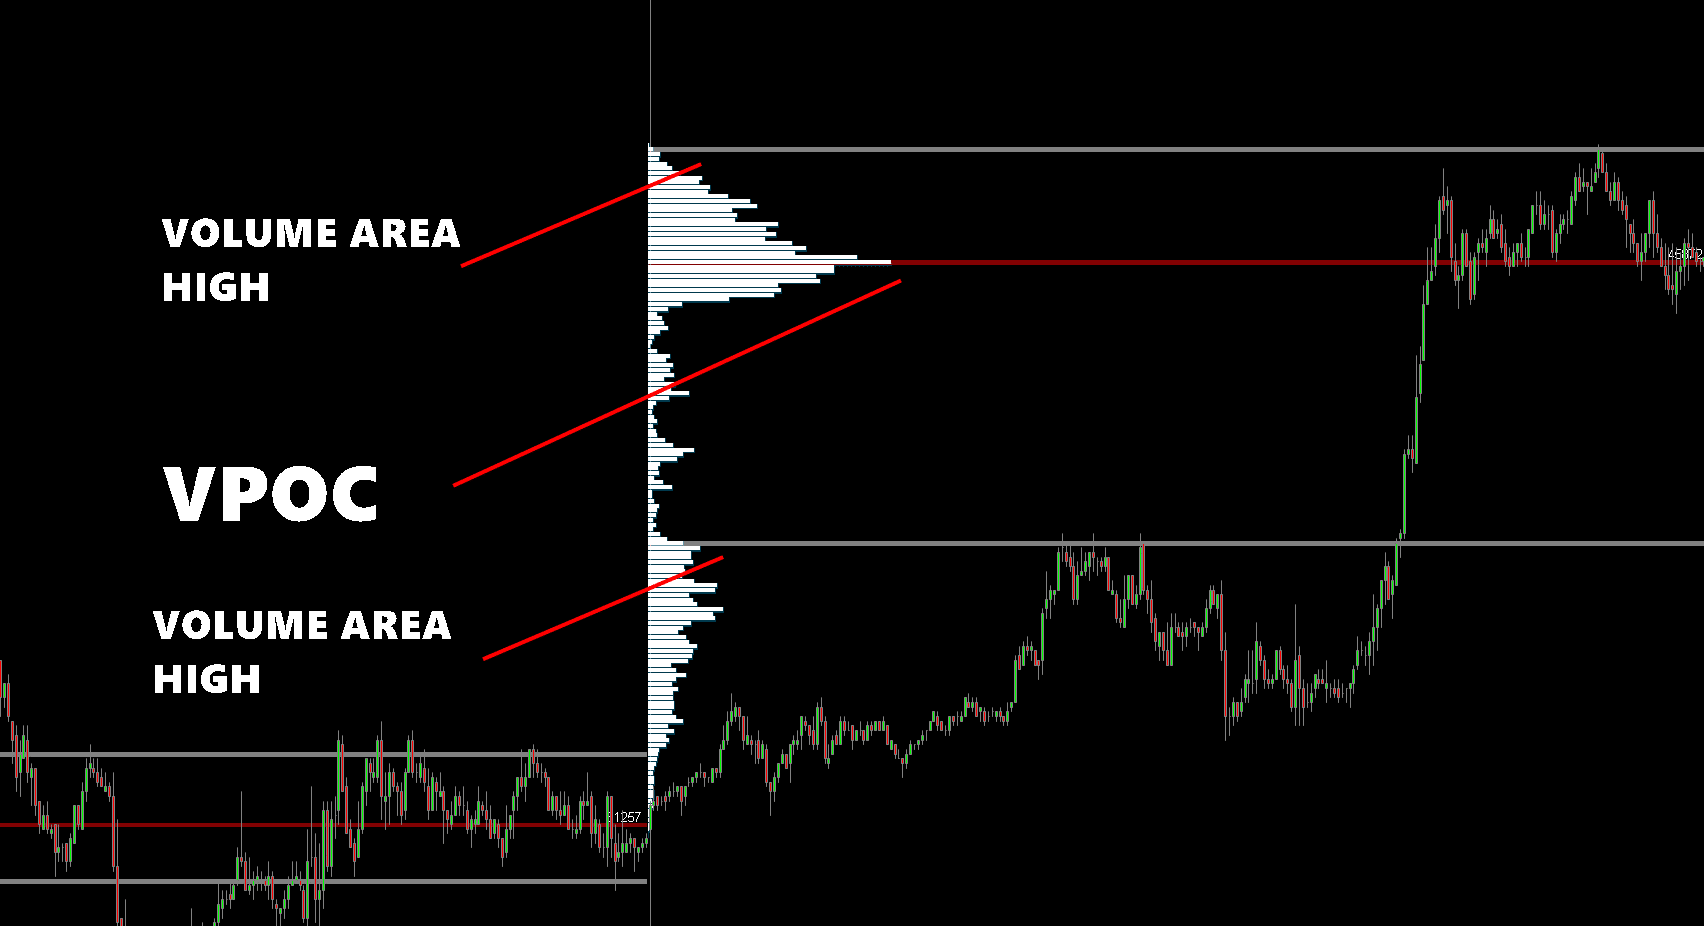
The Volume Profile shows you the vertical traded volume on the price. If one contract is traded on the market the Volume Profile point is as one volume. Traders can see where is the most volume and less volume is traded on the price and interpret the market movements. In addition, the Volume Profile got 3 important points that can be marked automatically.
The VPOC means the most traded volume on the price for a certain time period. The volume area with the 2 boundaries (volume area high and low) shows you an area where is the most volume is traded. There are different settings of the Volume Profile and you can adapt this tool to your trading style and strategy which we will discuss in the next sections.
Facts of the Volume Profile:
- Shows the vertical volume on price
- Can be attached to different time horizons
- Shows the most traded volume (VPOC)
- Show the value area (most traded volume area)
- Configure the Volume Profile your trading strategy
What is volume?
The trading volume is shown by the Volume Profile. It indicates that there was a match of a buyer and seller (1 contract) for one volume. The market is moving by executing limit orders which are consumed by market orders. On the stock exchange, you will see BID and ASK. These are limit orders. The trader buys or sells directly into it by a market order. If one contract is traded you will see one volume. Remember, you will always need a seller and buyer to match in order to trade.
Important points of the Volume Profile
The Volume Profile can show more than the vertical traded volume on the price. You can activate the VPOC (Volume Point Of Control) and the volume area (most traded volume in an area). These are very important points and indicators for developing trading strategies.
VPOC
The point of control shows you the most traded volume. It is very important for day trading. For example, you can mark the most traded volume of the day and the last days. The market will often test this area because it is a fair price. A fair price meant that a lot of traders want to buy or sell at this price.
Value Area
The value area contains the value area high and the value area low. It is similar to the VPOC but it is an area not only a price. The most popular setting is a 70 percent to 30 percent setting. 70 percent of the traded volume is shown in an area. It is an area with a fair price. The borders of this area are also important. You can develop different strategies which we will show you in the next sections.
The best Trading Software for the Volume Profile
On this page, we are using the Order Flow Software ATAS (Advanced Time and Sales) for the Volume Profile. From our experience, it is a very customizable platform and easy to use for beginners. But you can also use other trading platforms like Ninjatrader or Sierra Chart. All these platforms offer you the same tool.

ATAS is developed for stock, crypto, and futures trading. You can combine this software with any broker you want. The software got a very nice interface that is updated continuously. Traders can use different tools like order books, normal charts, footprint charts, smart tape, DOM, and more customized order flow indicators.
The recommendation is from our side is clearly ATAS because you can set up this software within seconds and start trading. In addition, you can test the platform for 14 days for free. Furthermore, the developer offers a subscription model or a lifetime license to buy. Read more about this software in our full review of ATAS.
Use a trusted broker for using the Volume Profile and future contracts
On this page, we recommend the future contract broker Dorman Trading. The broker was founded in 1956 and is based in the United States of America where it is a regulated company. You can connect your trading account to ATAS and start trading on the software with future contracts.

You will get a fast execution of your trades and there are no additional fees for your trading account. Dorman Trading is a clearing member of the CME Group and ICE. From our experience, Dorman Trading shows its clients a professional service. To start trading, you only need a $2,500 account minimum.
Settings of the Volume Profile
You can attach the Volume Profile on the side of the chart or on a time period. In our picture, you will see that we use the “external period” version. If you go to indicators (right-click) you can choose the indicator “market profiles”. This is the Volume Profile. To make it look like our trading desk you have to change some settings. We already showed it in the video above.
The external period means on which time horizon the volume profile is shown. You can change it for short time periods or long-term. For example, it is possible to show the Volume Profile on a weekly or monthly basis.
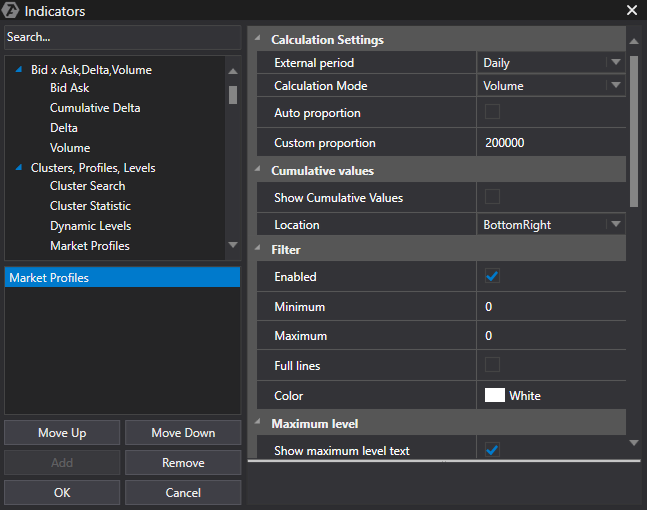
Another important setting is the “custom proportion”. The size of the volume bars is depending on the traded volume. Some markets got high liquidity and some not. So if you add the market profile to the chart do not be surprised. You may have to change the custom proportion to get a good overview. Furthermore, you can change the volume to the delta, trades, or time profile. This allows you to use different strategies.
The next sections only change the colors and areas of the Volume Profile. It is possible to show the VPOC, volume area, or not. All in all, it is very easy to customize the Volume Profile with ATAS. For detailed instructions, you can watch the video above where we showed it step by step.
Settings:
- Use it in different time periods
- Change the size
- Change the colors
- Edit the volume area and VPOC
- Show volume, trades, time, or delta
Can the Volume Profile used for forex?
A lot of traders are asking if you can use the Volume Profile for trading forex for example with the trading platform MetaTrader 4 or 5. First of all, it is possible to use the Volume Profile for trading forex but you need the real data of the stock exchange (currency futures). There is a difference between the futures market and the currency spot market of banks.
Volume Profile for the MetaTrader
Forex trading by using the MetaTrader gives you up to 99% access to the bank’s spot market of currencies. The volume can differ from broker to broker. In addition, most brokers are market makers which only match the orders between the traders. The volume in the MetaTrader is the “tick volume”. It is not the real volume. You will get the real volume by the data feed of the stock exchange for futures.
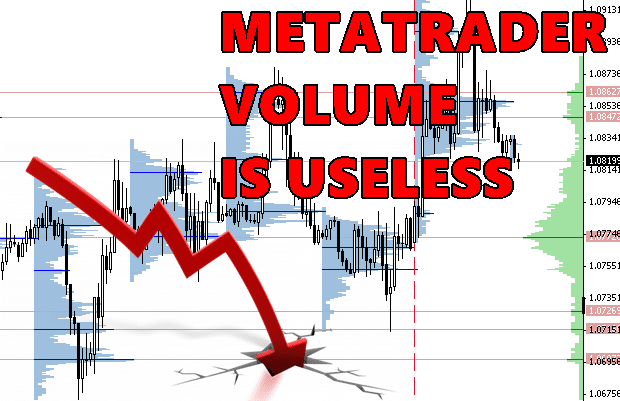
For using the Volume Profile correctly you have to trade and analyze the future contract of currencies (example 6E for EURO/USD future). By using the Volume Profile with the MetaTrader you will not get the right data of the volume. From our experience, it is useless to trade with the MetaTrader and analyze the volume. It is not the real data because the brokers do not provide it.
Facts about forex trading with volume:
- You can use the Volume Profile to trade forex
- You need to analyze the currency’s future
- MetaTrader brokers only offer forex spot volume which is useless
- Volume in the MetaTrader shows the “tick volume” (useless)
- You need an order flow software like ATAS and a data feed to trade correctly
Volume Profile trading strategies
In the previous sections, you have learned what is the Volume Profile. Now we will discuss some trading strategies which are easy to understand. The Volume Profile is a very powerful tool that can adapt to each time frame. No matter if you want to do short-term or long-term trades you can attach the tool to each timeframe.
From our experience, the best time horizon for day trading is daily. For scalping, you can use the hour profile or 4-hour profile. It is depending on your trading style. In the next pictures, you will see the 15 or 5-minute chart for trading. You can also use tick charts or range charts.
1. Strategy: Extend the VPOC
As you know the VPOC is the most traded volume. Most of the time the market wants to come back to the VPOC because the price is fair and a lot of traders want to buy or sell. For this strategy, you can mark the VPOC from yesterday and wait for the first touch. Often the price will show a reaction in this area.
The trading software can do this for you automatically and extend the VPOC line till the first touch. This strategy is very powerful for earning a few ticks in the market. Entries can be combined with the footprint chart to get a very small stop loss. In the picture below you will see an example of the VPOC strategy.
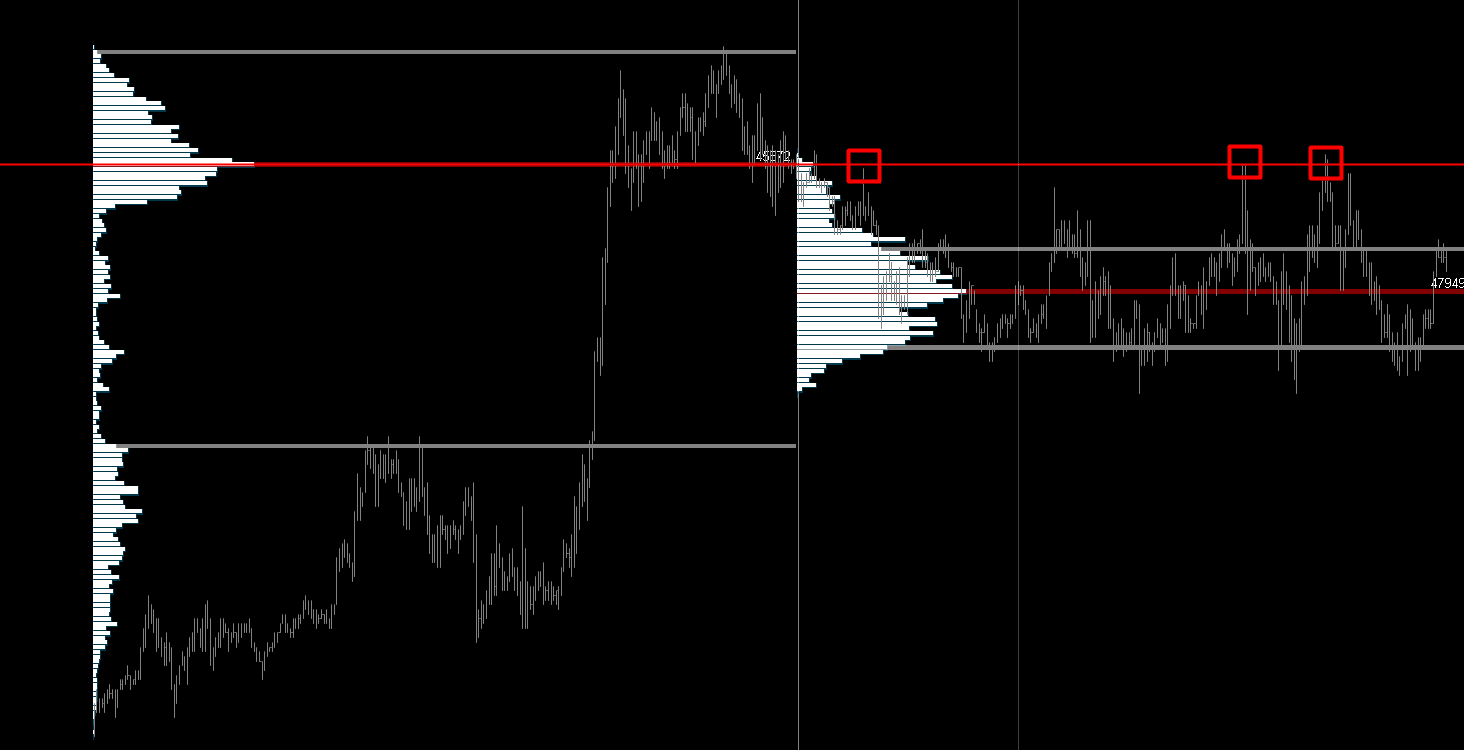
This picture is a really good example because the market tested this area more than 3 times. Furthermore, there are more indicators in the chart that show us that the trading idea could work. We will go into detail in the next sections.
It works very well if the next day the market traded away from this area and comes back. It is a real naked VPOC. Our recommendation is to do some backtests in the chart and search for possible entries.
VPOC strategy:
- Extend the VPOC from yesterday
- It should be a naked (untested) VPOC for the best success
2. Strategy: Analyze the trend with the Volume Profile
By using any strategy you can analyze the market trend very easily with the Volume Profile. Traders can focus on the volume area and search for a volume area shift or inside day. Trending markets or range markets can be spotted by analyzing the value area. But keep in mind the trend can be changing very fast this type of analysis only works with probabilities.
Inside Day:
It means that you will see the next value area is created in the value area of yesterday. Often it is a range market and the price will trade from value area high to value area low. See the picture below for a detailed example.

Trend Day:
The trend day meany a shift in the value area. The most volume is traded lower or higher than yesterdays. It indicates buyers or sellers who want to trade new prices. You will see a shift in the Volume Profile. See the picture below for a detailed example.
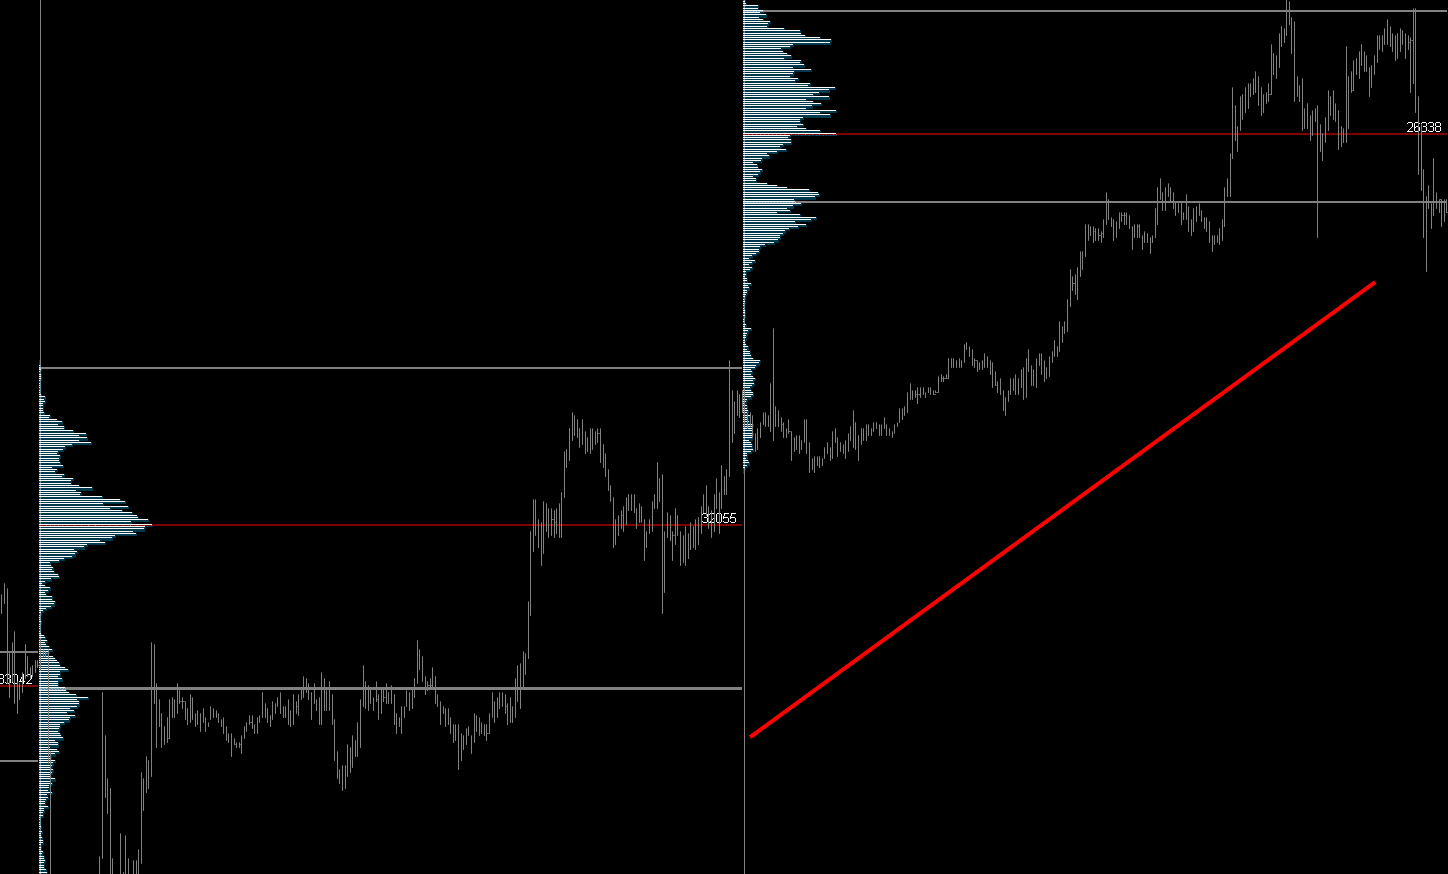
In addition, it can be an indicator for the next day that the trend will continue. To analyze the value area and volume is very important to get a big overview of the chart and possible trends. We recommend extending the value area of yesterday to see important price areas where the market will react maybe.
3. Strategy: Trade on the volume area high and low
This strategy is also based on the fact that the market is searching for liquidity. Where the most traded volume is there can be the most liquidity in the limited order book. You will see that the market often spends time in the value area. It is because the price is seen as a fair price by most traders. In the value area, there is 70 percent of the traded volume.
You can search for entries outside the value area and search for reversals. Wait for low volume. If the market does not want to trade the market will search for new prices. This can be a reversal. See the picture below for a detailed example.
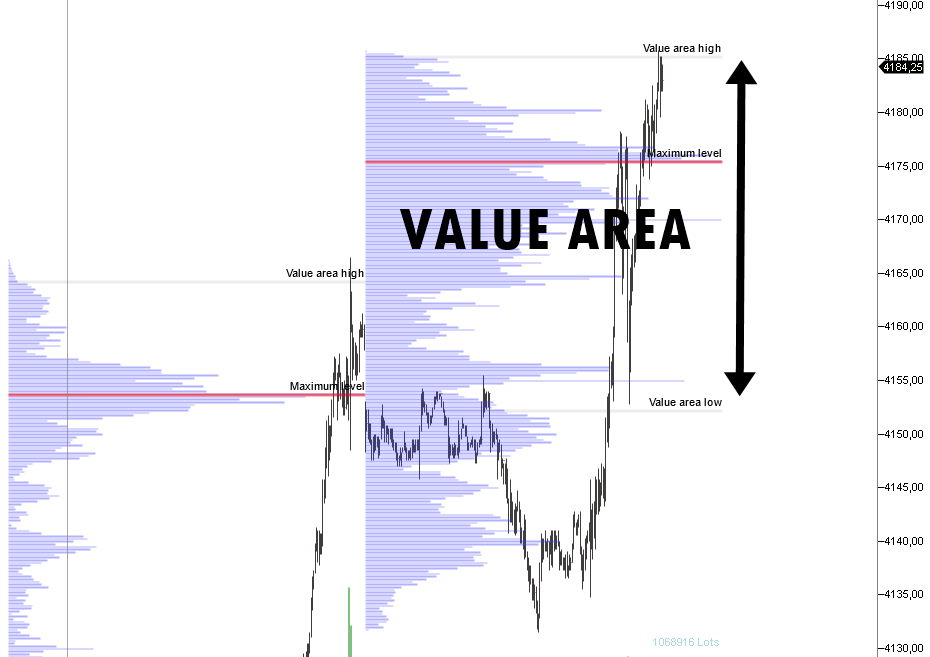
As you see in the picture these areas can be used as resistance and support levels. You can extend the value are from yesterday. If it is not touched it will work great.
All these strategies show you that the spots and areas of the Volume Profile are very important. We recommend doing backtests and analyzing the charts. You can start trading with a virtual practice account. For a more detailed look into the Volume Profile, our book will help you to become a successful trader.
Conclusion: Volume Profile charting and analysis are useful
On this page, we showed you how to use the Volume Profile by the ATAS trading software. This tool is available on most trading programs. But you should be aware if you get the right data for the analysis. The tools it working with future contract charts and data. You need the real trading volume of the stock exchange to make a professional analysis.
The Volume Profile shows you the vertical traded volume on the price and you will see important areas like the VPOC and value area. The key to success is to interpret the volume in the right way. The market will show you signs of accepted and unaccepted prices.
What is important about the Volume Profile:
- Volume area
- VPOC
- See the most traded volume
- See less traded volume
- Interpret trends or range markets
The Volume Profile is one of the best tools for any order flow and volume trader. It is simple to use and very powerful 

Trusted Broker Reviews
Experienced traders since 2013See other articles about online brokers:
Last Updated on April 28, 2023 by Andre Witzel
